Jiaqing Xu1,2, Thomas E. Bright 3,4, John Harry5, Chris Bishop1
Affiliations
1. Faculty of Science and Technology, London Sport Institute, Middlesex University, London, England, United Kingdom
2. Qualisys AB, Kvarnbergsgatan 2, Gothenburg, 411 06, Sweden
3. Department of Sport, Business and Media, Plymouth Marjon University, Plymouth, UK
4. Tournament Golf College, Cornwall, UK
5. Sport & Occupational Neuromechanics Laboratory, Department of Kinesiology & Sport Management, Texas Tech University, Lubbock, TX, USA
Vertical jump assessments such as the countermovement jump (CMJ) and drop jump (DJ) are widely used by strength and conditioning practitioners to evaluate slow and fast stretch-shortening cycle (SSC) function. However, administering both tests independently can increase testing time and logistical demands in applied settings. The countermovement rebound jump (CMRJ) has recently been proposed as an integrated assessment capable of capturing the characteristics of both slow and fast SSC performance within a single task. Despite growing interest, practical guidance on how the CMRJ should be implemented, coached and the subsequent data interpreted, remains limited. Therefore, the purpose of this article is to provide practitioners with an applied framework for optimising the use of the CMRJ in performance testing environments. Specifically, this article outlines key considerations related to task execution, verbal cueing, familiarisation and quality control procedures. In addition, a tiered framework for interpreting CMRJ metrics is proposed, prioritising performance outcomes, movement drivers and strategy metrics, and inter-limb asymmetry measures. Collectively, and for interpreting CMRJ outcomes, practitioners are encouraged to prioritise a small number of reliable outcome metrics for rapid performance profiling and to use additional metrics selectively to explain changes in performance, movement strategy or any existing side-to-side differences.
Vertical jump testing protocols are widely used in strength and conditioning (S&C) practice due to their simplicity, reliability and well-established associations with neuromuscular function and athletic performance.47, 56, 73, 83 Recent technological advancements, such as wireless force platforms, motion capture systems, and user-friendly mobile applications (e.g., Hawkin Dynamics, OnTraq by Qualisys and MyJump2) have further expanded the accessibility of jump testing across laboratory and field-based settings. These tools often require minimal setup time while providing immediate, actionable feedback. Nevertheless, the increased accessibility of jump testing technologies does not eliminate the challenge faced by S&C practitioners when deciding which tests and metrics should be prioritised.22, 44, 72 Different vertical jump protocols vary in their preparation demands (i.e., familiarisation), workflow organisation (particularly when working with large numbers of tests and athletes) and the level of post-processing that is required to report the metrics that matter the most.25, 64, 76
The countermovement jump (CMJ) and drop jump (DJ) are common assessment tests in S&C because they are specific to the movements that are typical in an athlete’s training and competition (e.g., triple flexion-extension of the hip, knee and ankle joints).69, 88 Both tasks also place a clear demand on the stretch-shortening cycle (SSC), with the CMJ typically employing slower SSC mechanics44, 65, 72 and the DJ employing faster SSC mechanics.33, 78 The SSC classification has broadly been classified as “slow” or “fast” based on whether the ground contact time is longer or shorter than 250 ms, respectively.69 However, it should be noted that these temporal thresholds are not absolute as contact times may overlap across tasks depending on execution strategy and task constraints. More specifically, slow SSC performance is characterised by athletes’ capability to generate force over a longer time period, often accompanied by greater lower-limb joint angular displacement. This capability is associated with sports tasks such as a maximal vertical jump performance or the initial acceleration phase in sprinting.69 Fast SSC performance, on the other hand, reflects the ability to rapidly attenuate and redirect high eccentric loads, a quality closely related to reactive strength and commonly observed during maximum speed sprinting and repeated jump tasks where the joint angular displacement is typically more constrained.79 While both slow and fast SSC capabilities are important contributors to athletic performance, evaluating their function using independent tests can increase testing time and logistical demands, particularly in applied settings involving large squads and congested schedules.85 To address this, the countermovement rebound jump (CMRJ) was proposed as an integrated assessment designed to examine both SSC characteristics within a single, continuous task.82, 84, 85, 86, 87
With the above considerations in mind, the purpose of this article is to provide S&C practitioners with a practical framework for understanding, implementing and interpreting data derived from the CMRJ, when used as an assessment protocol.
The CMRJ is designed to integrate the characteristics of the CMJ and DJ within a single assessment.85 The first jump resembles a conventional CMJ, while the second shares similarities with reactive jumping tasks such as the DJ or repeated jump protocols (e.g., 10/5 repeated jump test) that are already familiar to many S&C practitioners and athletes. Indeed, recent evidence suggests that outcome- and strategy-based metrics derived from the CMRJ may provide reliable alternatives for assessing both slow and fast SSC function in a single test, which are traditionally evaluated using the CMJ and DJ, respectively.84, 85 From an applied perspective, the CMRJ is also appealing because it does not require athletes to learn a novel movement pattern beyond those already encountered in routine jump testing. However, despite these similarities, the technical execution of the CMJ and DJ when performed within the CMRJ may differ meaningfully from their traditional standalone counterparts.
In isolation, the CMJ is appealing because it is quick to administer, non-fatiguing and requires minimal familiarisation, yet it still provides valuable insight into an athlete’s neuromuscular function and SSC capabilities.50, 51 The CMJ involves a downward motion initiated from standing prior to an upward motion in attempt to jump as high as possible. From a mechanical standpoint, the CMJ is characterised by a coordinated motion across the hip, knee and ankle joints, requiring effective inter-joint timing and distribution of mechanical work throughout the lower limbs.41, 84, 86 Literature has shown that, under typical CMJ execution, the knee joint often contributes the largest proportion of total joint work during both braking and propulsion, with additional contributions from the hip and ankle joints thereafter.37, 41, 84, 86 This highlights the importance of knee extensor musculature in generating net impulse during maximal CMJ performance. However, joint contribution strategies during the CMJ are not fixed. When countermovement depth is not externally controlled, athletes may adopt deeper or shallower countermovement strategies, which can alter the relative contributions of the hip and ankle joints while producing similar jump heights.63, 84 As a result, comparable CMJ outcomes may be achieved through different joint contribution strategies, especially when athletes lack familiarity with the test or when coaching instructions are unclear. This should be considered when interpreting CMJ performance relative to the CMRJ. Specifically, although the first jump resembles a CMJ during take-off, athletes are not instructed to perform a traditional jump and “stick” the landing during the CMJ portion of the CMRJ test (i.e., CMRJ1).86 Instead, this landing, more specifically touchdown, is performed with the intent to immediately rebound into the second jump (i.e., CMRJ2), which may alter landing mechanics and force attenuation strategies, thereby imposing greater physical demands than an isolated CMJ trial. This concept has been proven where metrics collected from the CMRJ have shown higher variability compared to the DJ and CMJ amongst physically active university students.84, 85
In contrast, the DJ is inherently more technically demanding than the CMJ and may therefore be challenging for some athletes (e.g., youth or untrained populations) to perform effectively.88, 89 The task involves stepping off a raised platform from a predetermined height (e.g., 0.3m) and, upon ground contact, attempting to jump as high as possible while minimising ground contact time.20, 21 Alongside the DJ, the depth jump is also commonly used in both research and S&C practice, with the distinction between the two exercises primarily determined by the ground contact strategy. Specifically, DJ technique emphasises the rapid reversal of downward velocity upon landing to minimise ground contact time, whereas depth jump technique involves greater displacement at the hip, knee and ankle joints. These differences are often influenced by the relative drop height imposed. When the drop height is lower than or comparable to an athlete’s maximal CMJ height, athletes are more likely to adopt a “bounce” strategy consistent with DJ execution. In contrast, when drop height exceeds the athlete’s capacity to rapidly attenuate and redirect eccentric load, the characteristic “bounce” behaviour is progressively lost and a more compliant, “countermovement-like” strategy, resembling a depth jump, emerges.16, 17, 20, 21 Consistent with this distinction, Bobbert et al.17, 18 described these movements as the “bounce DJ” and the “countermovement DJ”, respectively, reflecting whether the athlete can maintain a rapid SSC response or is forced to adopt a more compliant movement strategy. The former is more appropriate when the objective is to maximise the mechanical output of the knee and ankle extensors, while the latter more closely resembles the CMJ, where the musculature surrounding the hip joint plays a more prominent role.17, 18 For these reasons, it is important that the CMRJ2 reflects the technical characteristics of a true DJ rather than a depth jump so that fast rebound capability is captured.
The intensity of a DJ is primarily determined by the magnitude of the eccentric load, which is directly influenced by both drop height and system, but ultimately reflects the momentum or kinetic energy at ground contact that must be attenuated.18, 74, 75 When the prescribed box height exceeds an athlete’s capacity to effectively attenuate and redirect force, the resulting eccentric demands may surpass their ability to manage the imposed load,34 elevating potential injury risk and often leading to reduced mechanical efficiency and a diminished capacity to utilise fast SSC mechanics. Under these conditions, athletes frequently adopt a more compliant, “countermovement-like” rebound strategy.18, 19 Conversely, if the eccentric load imposed by the drop height is too small, the stimulus may be insufficient to meaningfully challenge fast SSC function. In the CMRJ, however, the drop height that initiates the CMRJ2 is self-selected and proportional to the athlete’s maximal CMJ height, thereby representing an eccentric load that is both familiar and within their capacity to manage.87 This also presents a practical advantage in squad-based testing environments, as drop height does not need to be individually prescribed or monitored, provided athletes are instructed to perform a maximal CMJ. Importantly, CMJ height has been shown to be relatively stable across two testing sessions (CV ≤ 6.6%),60, 62, 83 suggesting that the landing demands associated with the first phase of the CMRJ are likely to be both consistent and well tolerated for most athletes. Nevertheless, the physical demands of the CMRJ may exceed those of a traditional DJ when the height achieved in the CMRJ1 surpasses the box height prescribed during DJ testing. This is supported by evidence demonstrating greater knee joint negative and positive work during the CMRJ2 compared with the isolated DJ, indicating a greater requirement to attenuate and redirect force when the landing height exceeds the prescribed box height (e.g., 30cm) used in previous studies.84
Beyond load magnitude, differences in landing symmetry may further distinguish the CMRJ from the DJ. Harry et al.39 reported asymmetrical lead and trail limb knee joint positioning and displacement during the pre-contact phase of a step-off landing task, whereas such asymmetries were not observed when athletes landed from equal heights following a CMJ. Specifically, participants performing a CMJ adopted a more extended lower-limb posture at landing, characterised by reduced hip flexion and increased plantarflexion.39 This distinction is particularly relevant given that the rebound phase of the CMRJ is intended to be executed with minimal lower-limb joint displacement.84 These findings also suggest that externally imposed drop landing conditions may introduce asymmetrical pre-contact strategies that are less evident during self- initiated jumps.38, 40 Accordingly, when compared with landing from a fixed box height during the DJ, athletes performing the CMRJ2 may be less likely to exhibit asymmetrical pre-contact kinematics,82 further supporting its suitability for consistent and repeatable assessment in applied settings.
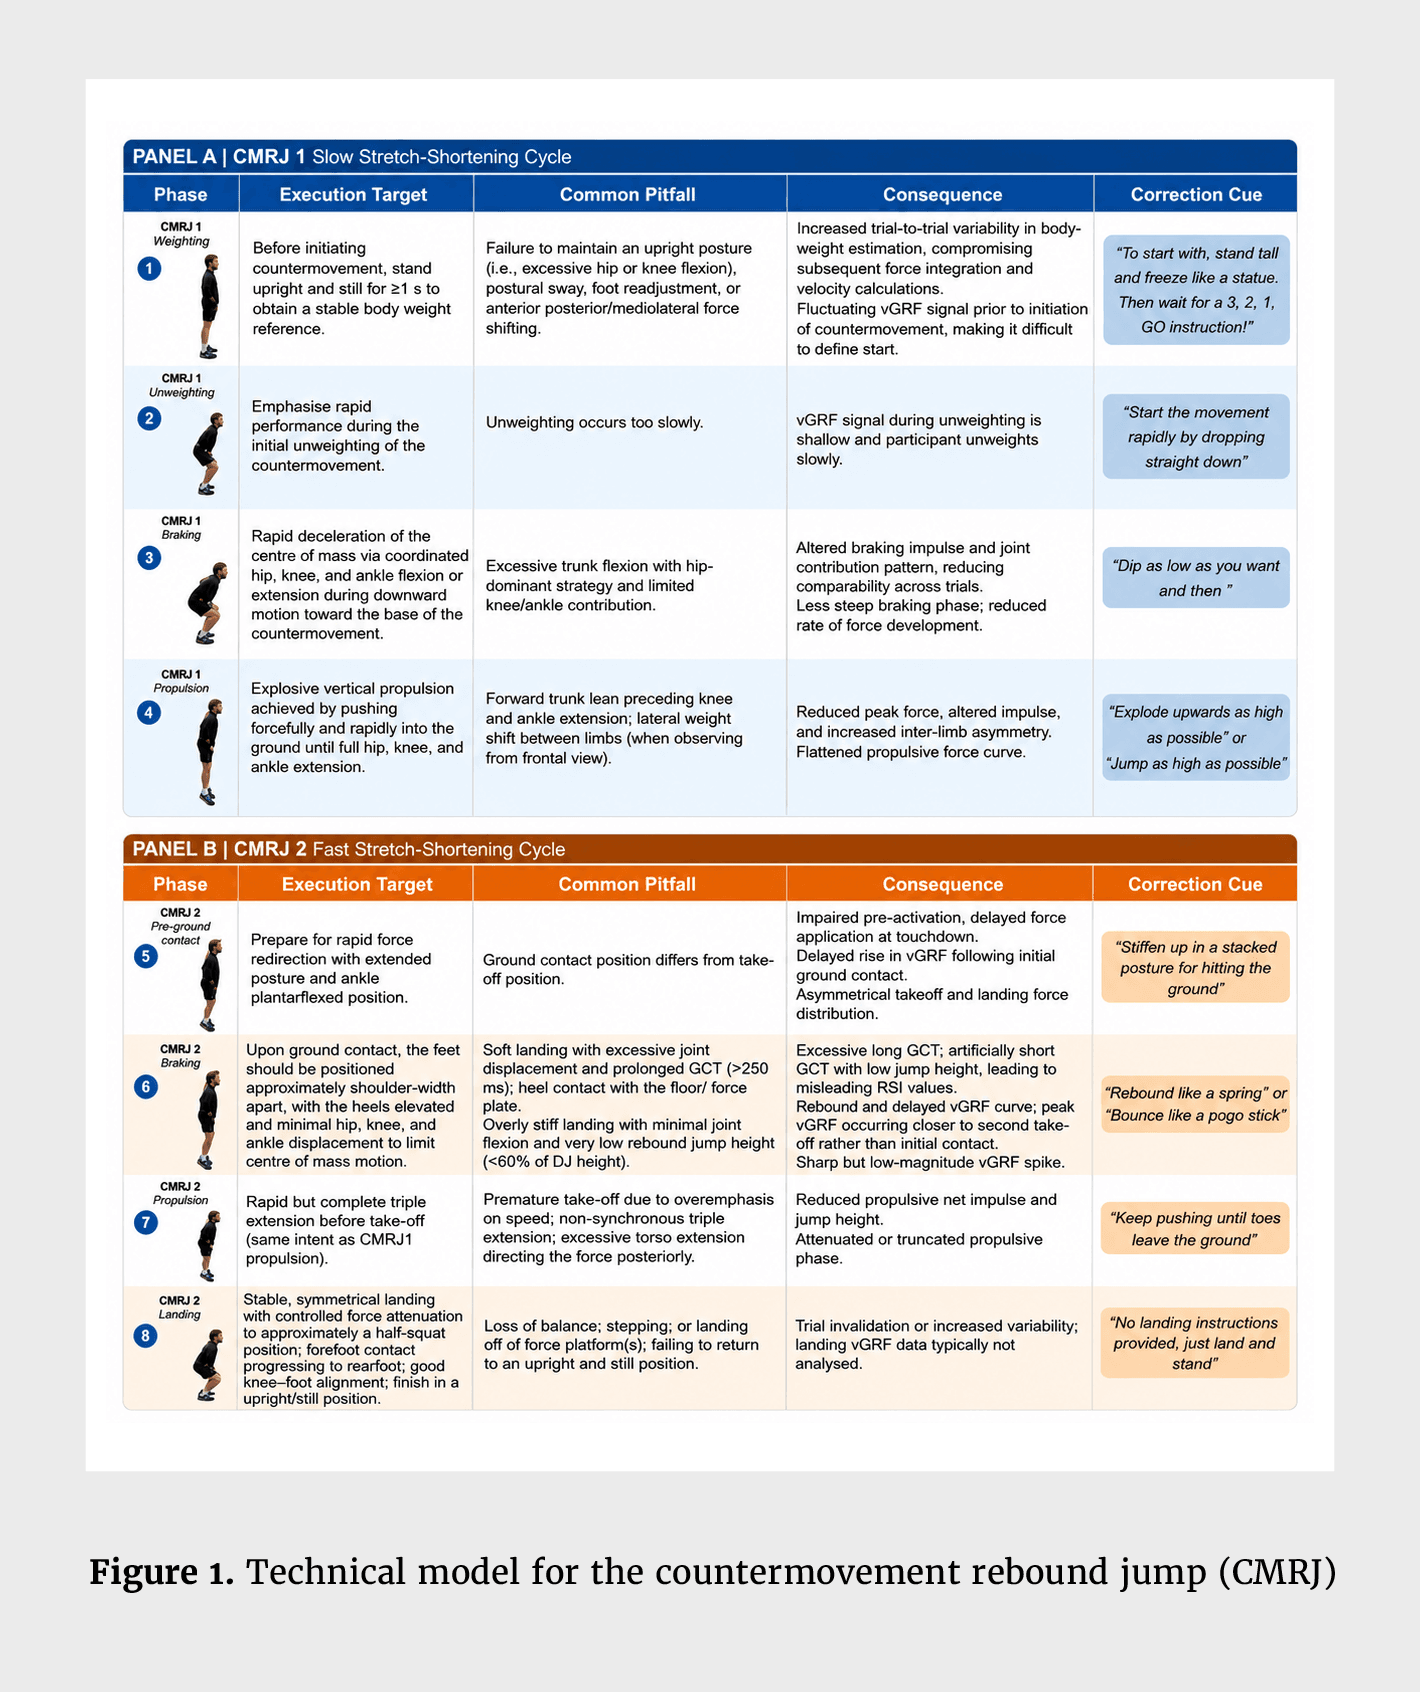
To assist practitioners with a conceptual target to direct their athletes toward, a technical model for the CMRJ has been provided (Figure 1), where the CMRJ is broken down into 8 phases. The movement objective for the first and second jump of CMRJ broadly resembles those of the CMJ and DJ, respectively. Although a minor consideration, across the entire task, athletes should maintain a consistent and standardised body position, including a shoulder-width stance, hands placed on the hips (when arm swing is restricted) and a fixed gaze at head height. From a postural perspective, the hip, knee and ankle joints should remain aligned in the frontal plane, with pelvis and spine held in a neutral position. During the braking and propulsive phases, coordinated and synchronised flexion-extension across the lower-limb joints is encouraged to promote efficient force attenuation and production. Practitioners are therefore advised to use this technical model as a reference framework to monitor key movement characteristics during CMRJ execution. Doing so can help minimise common technical pitfalls, improve trial-to-trial consistency and enhance the trustworthiness of CMRJ outcome metrics. Nevertheless, the inherent differences between CMRJ and other jump tests have resulted in some challenges observed during the applied practice.
As discussed previously, the substantial technical and physical demands of the CMRJ may prompt athletes to modify their movement strategies to achieve the intended outcome, potentially compromising execution accuracy. Consequently, the practical value of the CMRJ is highly dependent on how the task is instructed, implemented and quality controlled. If these elements are not clearly defined and consistently reinforced, movement strategies may gradually deviate, resulting in artificially reduced reliability and misleading data interpretations. This section outlines the key considerations for effectively implementing the CMRJ within S&C practice.
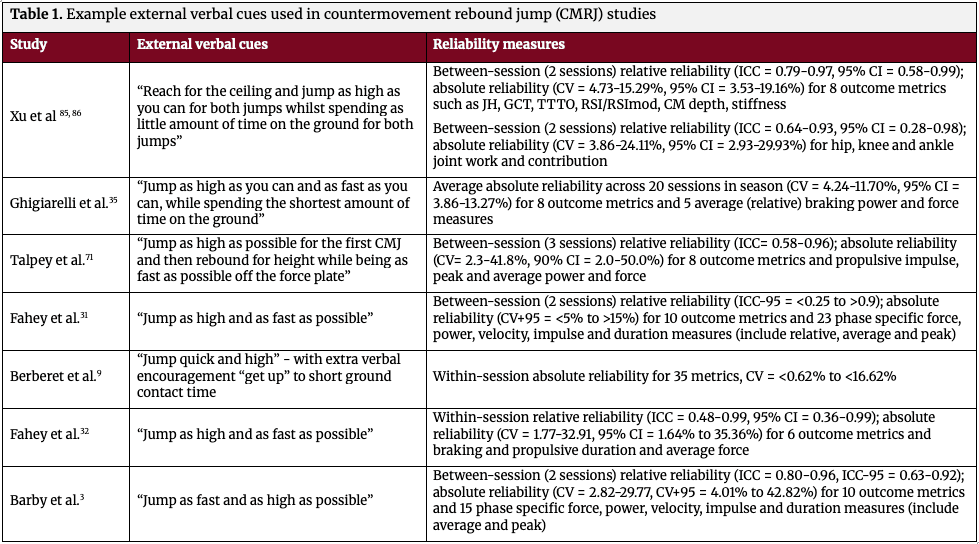
Consistent with the purpose of the CMRJ, external verbal cues should standardise a single external cue that directs attention toward two concurrent objectives: producing a high CMRJ1 (slow SSC intent) and executing a rapid, high-quality rebound with minimal ground contact time (fast SSC intent).45, 86 Across the literature, studies reporting acceptable-to-good reliability of CMRJ outcomes typically employ external focused cues that simultaneously emphasise height and velocity (Table 1). While a single “best” cue cannot be identified due to differences in study designs, populations and outcome definitions, a dual-focus instruction appears practically relevant because single-objective cues run the risk of causing bias in a given movement strategy.6, 66 For example, height-focused instructions may encourage athletes to perform the CMRJ as two continuous CMJs or a CMJ followed by a depth jump, thereby diminishing the fast SSC characteristics of the task.6, 66, 86 Conversely, cues that emphasise speed or minimal ground contact time in isolation, may promote premature take-off, excessive ankle-dominant “touch-and-go” strategies or insufficient force production to achieve a meaningful rebound height.16, 17, 88
In practice, cueing should also be viewed as a quality-control tool that both prevents predictable execution errors (as demonstrated in Figure 1) and corrects them when detected. When the CMRJ1 becomes overly deliberate (i.e., deep countermovement, prolonged braking and solid and flat foot landing with poor rebound readiness), a single corrective cue should redirect attention toward continuity and rapid force redirection rather than joint-level mechanics (e.g., avoid “bend less at the knees”). Conversely, when athletes performing a submaximal CMRJ1 in an attempt to preserve capacity for the second rebound, corrective cueing should reinforce maximal intent across both jumps to preserve the underlying purpose of the test. Simple external adjustments such as encouraging athletes to “push through the ground for longer” when they prematurely truncate the propulsive phase can effectively shift task intent toward greater impulse production, while concurrently preserving natural movement. In all cases, practitioners should apply one clearly defined adjustment at a time to avoid increasing cognitive load, followed by immediate reassessment.80, 8 Consequently, if execution remains unstable, additional familiarisation (discussed in the next section) or temporary task simplification may be required before reliable data can be obtained.24, 71
Following corrective cueing and before examining force-time curves or outcome metrics, practitioners are encouraged to perform a brief visual check of task execution through video recording.29 This initial check is not intended to replace any subsequent data analysis but acts as an initial ‘filter check’ to ensure the trial reflects the intended mechanical demands. Globally, practitioners should confirm that the task is performed as a continuous sequence, without hesitation or visible reorganisation between jumps.43 Observable behaviours such as excessive adjustments during the flight phase, looking down to locate the force platform(s), or compensatory actions to regain balance may indicate incomplete commitment to the task. Such trials often coincide with degraded mechanical outputs.56 Furthermore, practitioners should look for the consistency of movement strategies. Across repeated trials, large variability in movement rhythm or jump strategy further indicates an unstable solution and should prompt further familiarisation or potentially, corrective cueing.12
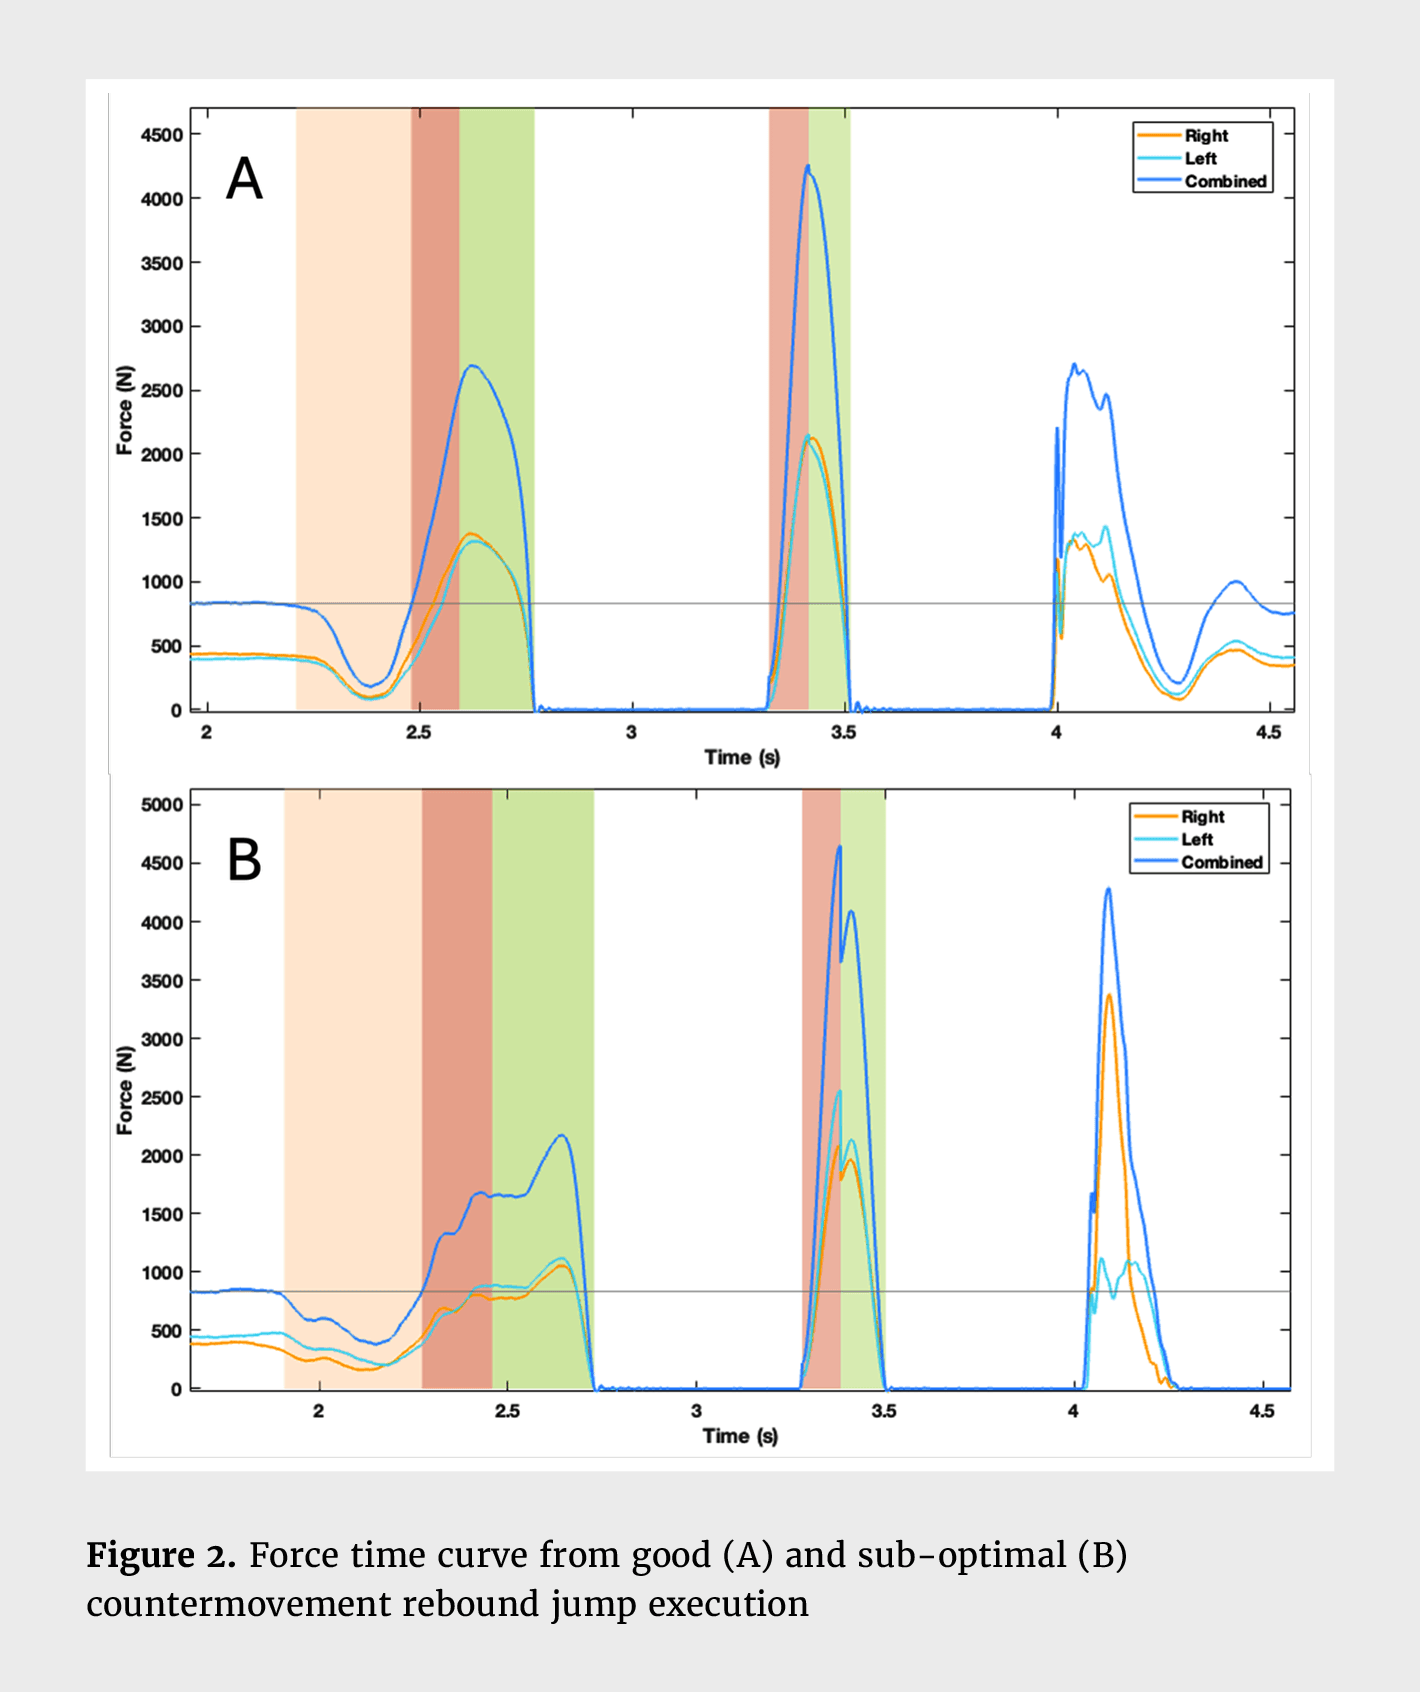
Finally, practitioners are encouraged to verify trial quality against the force-time curve because visually acceptable trials may still conceal anomalous asymmetrical loading, insufficient force magnitude or poor temporal alignment of force with key phases.29, 30 Figure 2 (A) demonstrates a “well executed” CMRJ profile. This is characterised by a stable weighing phase before movement initiation, followed by a sharp unweighting and a continuous, steep increase in vertical force from unweighting into the braking phase (generating substantial braking impulse).29, 30 Force contributions between limbs are generally symmetrical and a distinct propulsive peak is observed immediately prior to take-off. For the rebound, a rapid rise in force immediately after touchdown and a well-defined peak early in ground contact are consistent with superior pre-activation, high lower-limb stiffness and synchronised triple-joint extension.52, 53 In contrast, Figure 2 (B) represents a less efficient CMRJ. The athlete exhibits a slower countermovement with a visible “plateau” in braking force, suggesting reduced utilisation of stored elastic energy and a greater reliance on concentric muscle action. While this pattern may reflect sub-optimal SSC utilisation, it may also represent an athlete’s current neuromuscular capacity rather than an execution error.54 Importantly, improvements in this profile are likely dependent on training-induced adaptations over time and therefore should not be expected to occur immediately within or between testing sessions. Although a minor point, this athlete also failed to stabilise upon landing from the CMRJ2, requiring an additional step to regain balance (i.e., stepping off from the force plate). Furthermore, significant inter-limb asymmetry is evident when landing from the CMRJ1, potentially reflecting poor technical coordination, which would likely remain undetected through visual observation alone.39 However, it should be noted that interpreting force-time curve shapes in isolation may be overly simplistic. A study by Lake and McMahon48 examined within-subject agreement of CMJ force-time curve shapes in 15 men performing 10 CMJs. Over the 10 trials, none consistently demonstrated a unimodal pattern, 60% consistently displayed a bimodal pattern, and 40% switched between unimodal and bimodal curve shapes, highlighting considerable within-subject variability in CMJ force application strategies. Thus, bimodal force-time characteristics may reflect differences in joint contribution strategies, such as altered proximal-to-distal sequencing and greater hip and knee-dominant moment generation,67 where unimodal reflect minimum joint angular displacement, but a more reactive strategy.68 Collectively, linking visual screening to force-time verification strengthens quality control and improves confidence that CMRJ-derived metrics reflect meaningful expressions of slow and fast SSC function.
Proper administration of any performance assessment is fundamental to methodological reliability. To ensure robust and consistent data collection, participants should be adequately familiarised with the testing procedures.25 Familiarisation sessions help minimise learning effects that may confound performance outcomes,5, 25, 27, 60 while also enhancing participant confidence and engagement.59, 64 For relatively simple tasks such as the CMJ, familiarisation requirements appear minimal in trained populations.23, 36 However, CMRJ is inherently more technically and physically demanding than the CMJ and DJ performed in isolation, the authors contend that careful consideration should be given to implementing an appropriate familiarisation process prior to formal testing. Building on this, it is also important to recognise that younger individuals, particularly those with limited training experience and lower relative strength levels, are likely to require a more extensive familiarisation period before confidence can be placed in the data obtained.71, 76 We advocate for the CMRJ to be broken down into the phases outlined in Figure 1 for the purposes of first familiarising an athlete with the movement.
To begin with, prioritisation should be given to ensuring that the athlete stands still and upright at the start and end of the CMRJ (i.e., stable weighing period pre-jump and post-landing).77, 83 If the athlete is indeed still and upright, this can be used as a zero-velocity reference; however, any amount of joint flexion during the weighting phase will violate this assumption and in turn have a knock-on effect towards phase identification and variable calculation.50 Once this is achieved, it makes sense to encourage that the athlete executes the CMRJ1 in isolation with a consistent movement strategy, producing consistent jump heights while using their self-selected countermovement depth. Of note, other force-time metrics may vary, but these often reflect individual strategy changes rather than task error per se.85
Once competency is demonstrated in the CMRJ1, emphasis should shift toward pre-ground contact kinematics and neuromuscular preparation prior to the rebound phase. As outlined in Figure 1, effective rebound performance is strongly influenced by posture and activation during the late flight phase of the CMRJ1.85 Athletes should be familiarised with maintaining an upright trunk, forward gaze and appropriate centre of mass alignment, while adopting a pre-activated, stiff lower-limb position before touchdown. Passive descent, downward gaze or excessive dorsiflexion prior to contact may delay force application and compromise leg stiffness, resulting in prolonged ground contact times and reduced rebound performance.18, 38, 40, 82 Therefore, maximal-intent CMRJ trials should only be introduced once consistent and repeatable pre-contact mechanics are demonstrated.
It is important to note that the place to start and progress within and between each of the stages outlined in Figure 1 requires a degree of subjectivity. Nonetheless, this approach reduces cognitive overload and ensures that full-task execution reflects technical competency rather than compensatory strategies. Such an approach is particularly important in youth, novice or lower-strength populations, where the integration of fast SSC characteristics may require deliberate exposure and feedback before reliable data can be obtained.
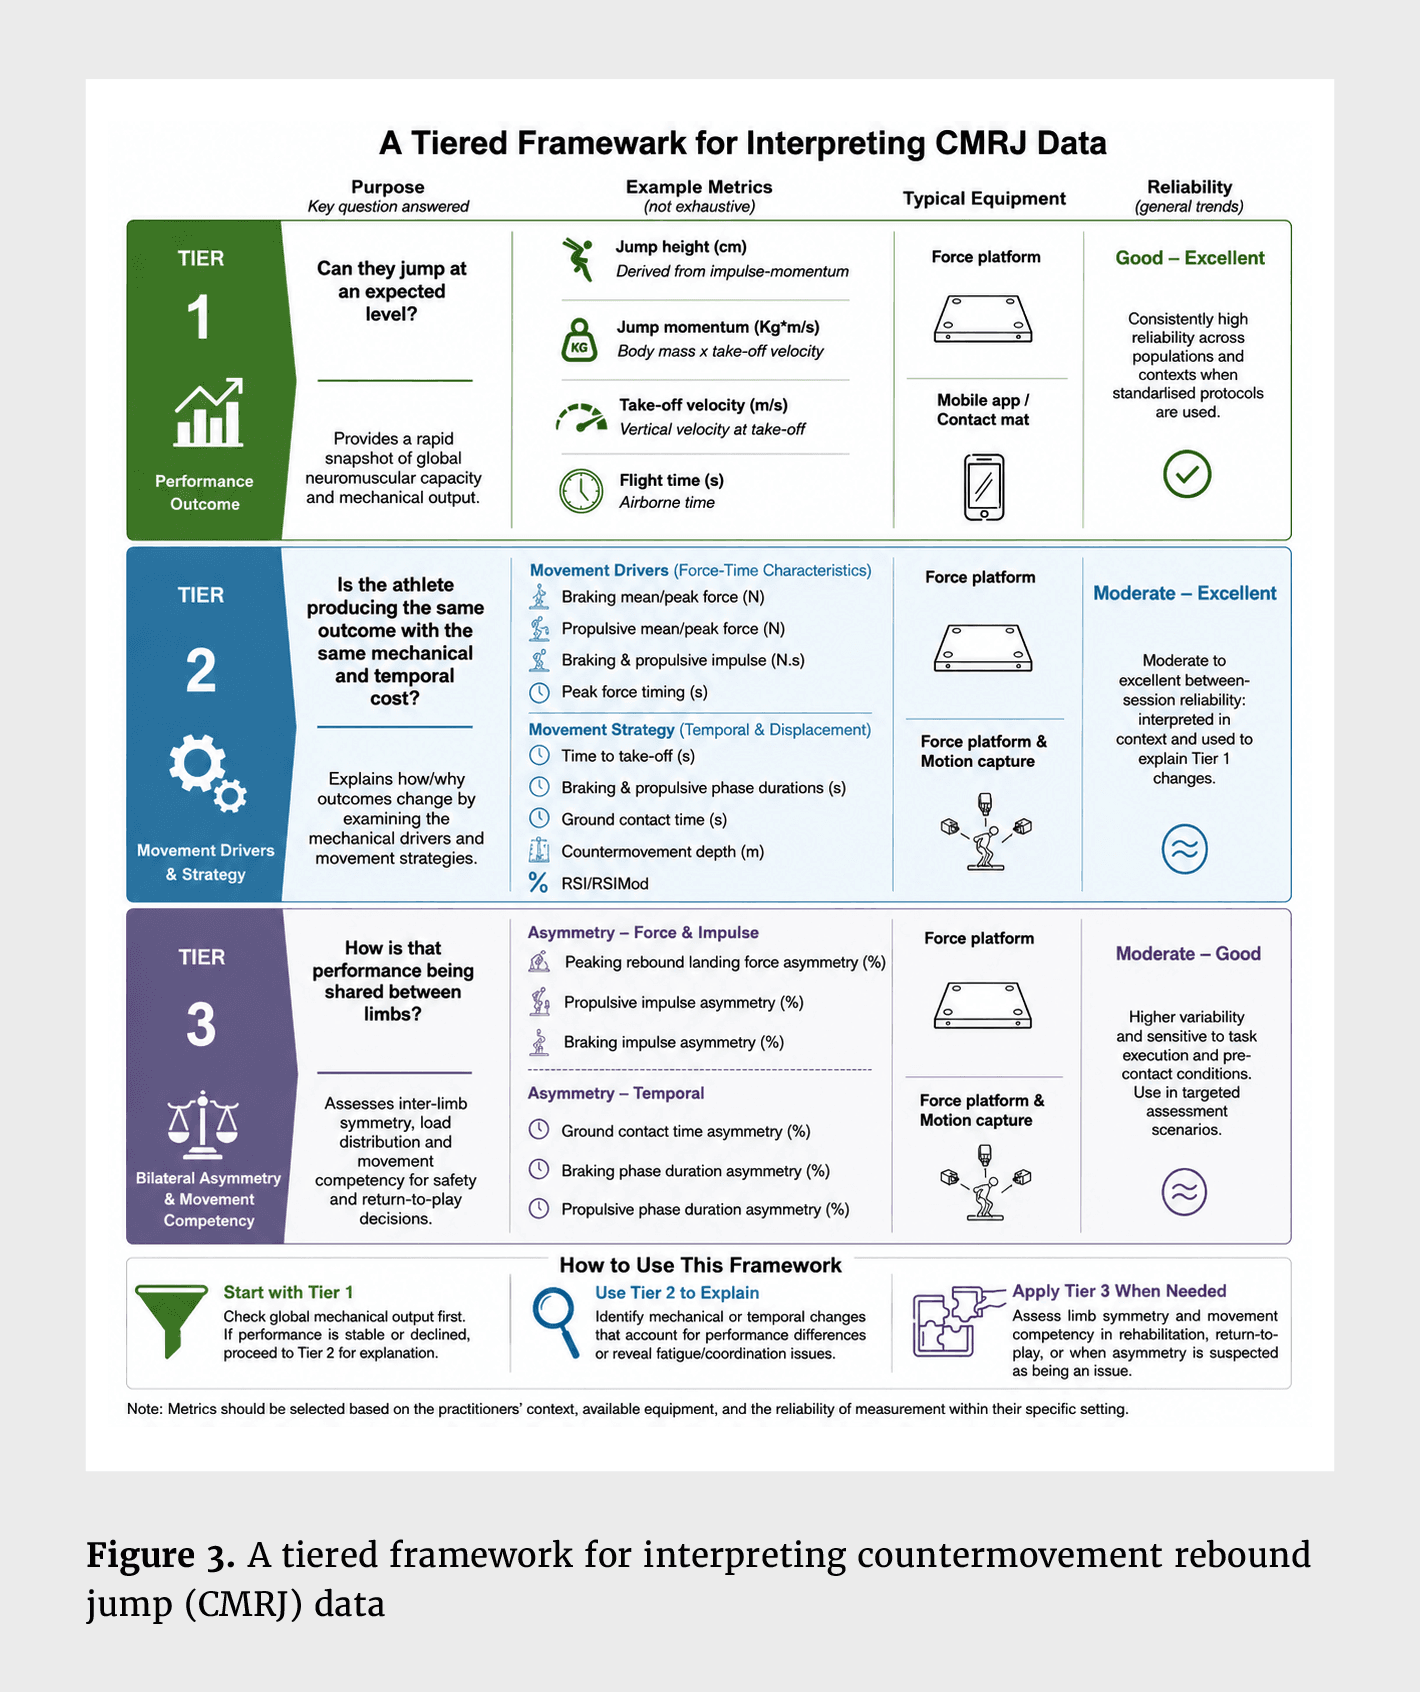
Much like data collection for any vertical jump assessment, the type and resolution of CMRJ metrics that can be reported may be determined by the equipment and processing workflow available. Where practitioners are limited to contact mats or mobile application-based jump systems, outcome metrics may be restricted to flight-time derived jump height, contact time and ratio values of these two (i.e., reactive strength index [modified]).28, 83 While these variables provide a practical overview of performance, they offer limited insight into the mechanical and neuromuscular processes underpinning task execution. In contrast, high-frequency dual force platforms enable phase-specific kinetic variables, centre-of-mass kinematics via numerical integration and limb-specific loading characteristics. This substantially expands the analytical scope of the CMRJ, with well over 100 potential metrics describing performance output, movement strategy, fatigue sensitivity and return-to-play readiness.10, 13 When force platforms are synchronised with two- or three-dimensional motion capture systems, further joint-level kinetic and kinematic variables (e.g., joint moments, power, work, angular velocity and displacement) can be derived. Despite this analytical richness, it is neither feasible nor time efficient for practitioners to interpret such an extensive set of metrics when evaluating a movement that unfolds within approximately 1-2 seconds. Most importantly, not all metrics are highly reliable across adjacent sessions and the indiscriminate reporting of large numbers of CMRJ metrics may obscure, rather than clarify, meaningful performance changes. Rather than proposing an exhaustive list, we recommend a tiered framework that matches the decision practitioners want to make with the minimum number of reliable, interpretable metrics.
For applied testing, the primary question facing practitioners is whether the athlete can currently produce sufficient mechanical output. Tier 1 outcome-based metrics (including jump height, jump momentum, take-off velocity and flight-time) are therefore intended to provide a rapid snapshot of an athlete’s global neuromuscular capacity, answering a very fundamental performance question: “Can they jump and produce force at an expected level?” In practice, this judgement is typically made by benchmarking an athlete’s performance against normative data reported in the literature or against internal standards within a team or training group.2 For example, recent work has begun to establish percentile-based normative values for the CMRJ, allowing practitioners to contextualise individual performance relative to population benchmarks using descriptors (e.g., poor to good) or normalised data such as z- or t-scores.9 Outcome-based metrics are well suited to this purpose because they describe the net result of force application to the ground, which are capabilities that underpin sprinting, change-of-direction and other complex sports-specific movements, rather than the underlying coordination strategy utilised to achieve them.13, 44 For practitioners managing large squads, congested competition schedules or limited testing windows, these variables are very intuitive and allow rapid decision making without the need for secondary data processing or extensive biomechanical interpretation.1, 9 Jump height represents the most familiar and widely reported indicator of vertical performance; however, reporting jump height alone does not provide insight into how that outcome was achieved.61 Specifically, while jump height is determined from take-off velocity via the impulse-momentum theory, it does not indicate the force-time characteristics underpinning that velocity. Accordingly, the inclusion of take-off velocity and jump momentum provides complementary information regarding mechanical output, with velocity reflecting the kinematic determinant of displacement and momentum providing a mass-related descriptor of the mechanical demand and impulse generated during propulsive phase.48, 54 From a mechanical perspective, jump momentum reflects the outcome of propulsive impulse through the impulse-momentum relationship.61 However, momentum may be easier for coaches and athletes to understand in practice, as it is a more common term and simply reflects how fast they moved their body mass at take-off, which may be more intuitive than interpreting the product of the summation of net force applied and the time during which the force was applied.58 Importantly, Tier 1 metrics are among the most reliable variables reported across CMRJ, CMJ and rebound-jump literature when standardised cueing is applied, demonstrating good to excellent test-retest reliability across sessions, populations and competitive levels.3, 9, 31, 32, 71, 84, 85 The consideration of reliability is central to their applied value: when Tier 1 metrics change meaningfully (i.e., when the magnitude of change exceeds typical measurement error), practitioners can be reasonably confident that a true change in performance capacity has occurred, rather than a fluctuation driven by measurement noise or strategy variability.13
Another practical advantage of focusing on Tier 1 metrics is accessibility. Jump height, flight-time and take-off velocity can be obtained from a wide range of systems, including mobile applications and force platforms.4 In addition, body or system mass is typically known or easily measured. This allows the CMRJ to be integrated into existing monitoring systems without substantial methodological changes, making Tier 1 metrics transferable across environments and organisations, facilitating benchmarking, longitudinal tracking and communication between stakeholders. However, focusing on outcome metrics first is also a deliberate simplification.13, 15, 48 Athletes may achieve similar jump heights and take-off velocities via markedly different strategies, particularly during complex CMRJ task.85 Tier 1 metrics therefore do not explain how performance was achieved or identify compensatory strategies that may hidden under fatigue or injury. Instead, they serve as an efficient ‘first-pass filter check’ – meaning that when mechanical output is preserved or declined (especially following a training intervention or congested competitions period), practitioners are encouraged to evaluate higher-tier metrics that provide better insights into fatigue, coordination and movement strategies.1, 13, 15, 48
Tier 2 metrics are intended to explain how or why an outcome has changed or been maintained by examining the mechanical drivers and movement strategies underlying CMRJ task execution. This tier becomes particularly informative when practitioners suspect changes in efficiency, coordination or neuromuscular fatigue that are not evident from outcome metrics alone. In practice, Tier 2 is trying to answer: “Is the athlete producing the same outcome with the same mechanical and temporal cost?”
Movement drivers represent the force-time characteristics that directly underpin performance outcomes. In the CMRJ, these include phase-specific force, impulse and velocity, which collectively determine the magnitude of centre-of-mass deceleration and acceleration. Phase-specific kinetic variables derived from force platforms (e.g., braking and propulsive mean or peak force, net impulse) can therefore provide insight into whether changes in jump performance are driven by alterations in force magnitude, force application duration or both.46, 57 For example, examining braking and propulsive force characteristics, as well as the timing of peak force within each phase, allows practitioners to better understand how downward movement is coupled with subsequent upward propulsion and overall jump performance.55, 56 Recent evidence further highlights the importance of evaluating these mechanical drivers alongside outcome metrics, as alterations in jump height may arise through multiple mechanical pathways. For example, increases in jump height can result from longer propulsive duration with unchanged force application, leading to greater net impulse. It can also result from higher propulsive mean velocity, even in the absence of meaningful changes in metrics shown to produce greater jump heights, such as countermovement depth.26 These findings emphasise that similar performance outcomes may be underpinned by distinct mechanical solutions, reinforcing the value of driver metrics for interpreting Tier 1 changes.
Movement strategy metrics describe the temporal and displacement-related cost of achieving a given outcome. In the CMRJ (or any jump type), this cost is commonly expressed through time-based variables (e.g., time to take-off, ground contact time, braking and propulsive phase durations) and ground-based displacement-based variables (e.g., countermovement depth and propulsive phase displacement). For the CMRJ1, time to take-off and phase durations offer complementary insight into rhythm and coordination, helping to identify whether preserved output is achieved through altered phase organisation (strategy) rather than unchanged propulsive impulse-generating capacity.7, 54, 70 Prolonged braking phases or a relative shift toward longer propulsive durations may indicate a deliberate strategy by allowing more time to develop force or by relying more heavily on concentric muscle action to generate impulse.3, 54 In the CMRJ2, ground contact time serves as a direct indicator of fast SSC behaviour, given that the CMRJ1 height is constant. Longer contact times (> 250 ms) reflect a greater temporal cost to sequentially slow down, stop and speed up the centre of mass, which may be associated with reduced reactive capacity, suboptimal utilisation of stored elastic energy or altered joint-dominant strategies (e.g., reduced ankle joint contribution).19, 84 Ratio-based metrics such as RSI and RSImod integrate performance outcomes with temporal constraints and are therefore commonly used to summarise SSC efficiency. While these indices provide a convenient overview, they are inherently composite and may change due to alterations in force, timing or both.10, 12, 13 Consequently, interpretations of RSI and RSImod should be supported by inspection of their constituent variables (e.g., jump height or flight time alongside timing elements) to avoid misattributing changes to neuromuscular capacity alone.
From a practical standpoint, Tier 2 metrics are valuable because they help explain how output is achieved; however, they should be interpreted with appropriate caution. Many commonly reported movement drivers and strategy-based metrics, such as countermovement depth, leg stiffness and braking-phase kinetic characteristics have demonstrated greater between-session variability and poorer test-retest reliability than Tier 1 metrics, particularly in youth and in-season contexts.3, 32, 71, 85 Importantly, this variability does not necessarily reflect measurement error alone, but may also indicate that performance can be achieved through multiple movement strategies, making it difficult to identify a single “dominant” solution. In addition, several frequently reported variables, including phase-specific peak or mean power and rate of force development, are not recommended for routine interpretation during CMRJ task. These metrics often exhibit low reliability, high signal-to- noise and limited added explanatory value beyond the Tier 2 metrics proposed above.49 Consequently, observed changes in such variables are more likely to reflect adaptive or compensatory movement solutions rather than true alterations in neuromuscular capacity. Metrics in Tier 2 are best used as explanatory tools to contextualise changes (or stability) in Tier 1 performance, rather than as standalone indicators for routine monitoring when using CMRJ test.
Tier 3 metrics are primarily intended to support assessments of movement competency, where the focus shifts from overall performance capacity to how safely and symmetrically mechanical load is distributed between limbs.11, 39 This information may help practitioners identify residual deficits following injury or periods of rehabilitation. As mentioned, asymmetries in force application and attenuation or temporal characteristics can persist and may not be captured by Tier 1 and Tier 2 metrics alone.82 At this stage, the practitioner’s question transitions to “How is that performance being shared between limbs?” Metrics in this tier typically include peak rebound landing force, inter-limb asymmetry in braking and propulsive force or impulse across both jumps of the CMRJ. Phase-duration and contact time asymmetry may also be informative in cases where athletes adopt premature or asynchronous take-off strategies, such as when athletes prioritise movement velocity, leading to one limb taking off earlier despite similar magnitude of peak phase-specific force outputs.11, 39
Although asymmetry in CMRJ metrics has received limited attention in the literature, available evidence suggests that asymmetry measures, particularly those derived from the rebound landing and barking phases, exhibit substantial variability. Fahey et al.31 reported poor-to-moderate absolute and relative reliability for rebound landing force variables and landing stiffness, while Xu et al.82 observed low agreement for net braking impulse asymmetry during the rebound phase (Kappa coefficient = 0.19), with approximately 33% of participants switching the dominant braking limb between sessions. It is also important to recognise that the asymmetry during the CMRJ may be influenced by pre-ground contact kinematics,38, 39 including limb positioning or joint configuration at touchdown, which in turn, can affect how load is distributed during the braking phase and upon rebound landing. Variability in these pre-contact conditions may therefore contribute to the between-session inconsistency commonly reported for asymmetry metrics, even in the absence of meaningful changes in global output or movement strategy.38, 39
From an applied perspective, Tier 3 metrics reflect not only inter-limb loading characteristics, but also task execution and entry conditions. As such, asymmetry magnitude may be reduced following adequate task familiarisation and targeted verbal cueing designed to encourage symmetrical landing strategies. However, whether explicit cueing to promote symmetrical landings can meaningfully reduce asymmetry in the CMRJ remains unclear and warrants further investigation.13 Given their variability and strong dependence on execution context, Tier 3 metrics are best applied in targeted assessment scenarios, such as pre-season assessment, late-stage rehabilitation, return-to-play progression or post-injury reconditioning, where the practitioner’s focus has shifted from performance capacity to load distribution and movement safety.8, 14, 42 In these situations, asymmetry metrics should be interpreted on an individual basis and in conjunction with clinical information and movement observations, rather than as isolated indicators of injury risk.13, 15
The CMRJ provides practitioners with a time-efficient and integrated assessment of both slow and fast SSC functions within a single task. When implemented appropriately, it can reduce the need for separate CMJ and DJ testing while still offering meaningful insight into neuromuscular performance. The value of the CMRJ lies not in the number of metrics it can generate, but in how the test is coached, familiarised and interpreted. Clear and consistent verbal instructions, adequate familiarisation, stable execution conditions and prior quality check are essential to ensure that collected data reflect neuromuscular function rather than task variability (Figure 1). To facilitate applied interpretation of CMRJ data, Figure 3 provides a tiered framework that categorises outcome measures according to their practical purpose, underlying mechanical interpretation, equipment requirements and typical reliability characteristics. Global performance outcome measures (Tier 1) are well suited for routine monitoring establishing meaningful changes over time, while more movement driver and strategy-based variables (Tier 2) should be used selectively to explain changes in performance rather than tracked indiscriminately. Asymmetry and movement competency metrics should be applied in targeted scenarios, where understanding load distribution and movement safety is prioritised over maximal output. Collectively, practitioners should recognise that changes in CMRJ performance may arise from multiple mechanical solutions. By adopting a tiered approach to data interpretation and prioritising execution quality alongside metric selection, practitioners can use the CMRJ not only to quantify performance, but to better understand how that performance is achieved and whether it is expressed safely and consistently.
1. Anicic, Z, Janicijevic, D, Knezevic, OM, Garcia-Ramos, A, Petrovic, MR, Cabarkapa, D, and Mirkov, DM. Assessment of countermovement jump: what should we report? Life 13: 190, 2023.
2. Argus, CK, Gill, ND, and Keogh, JW. Characterization of the differences in strength and power between different levels of competition in rugby union athletes. The Journal of Strength & Conditioning Research 26: 2698–2704, 2012.
3. Badby, A, Comfort, P, Ripley, N, Cuthbert, M, Robles-Palazón, F, Mundy, P, and McMahon, J. Which Metrics Can I Monitor? Test-Retest Reliability of Countermovement Jump and Countermovement Rebound Jump Force-Time Metrics in Youth Soccer Players In-Season. International Journal of Strength and Conditioning 5, 2025.
4. Balsalobre-Fernández, C, and Varela-Olalla, D. The validity and reliability of the My Jump Lab App for the measurement of vertical jump performance using artificial intelligence. Sensors 24: 7897, 2024.
5. Balster, W, Lim, CXE, and Kong, PW. Effects of a deeper countermovement on vertical jump biomechanics after three weeks of familiarisation–preliminary findings. International Journal of Human Movement and Sports Sciences 4: 51–60, 2016.
6. Barillas, SR, Oliver, JL, Lloyd, RS, and Pedley, JS. Kinetic Responses to External Cues Are Specific to Both the Type of Cue and Type of Exercise in Adolescent Athletes. The Journal of Strength & Conditioning Research : 10.1519, 2022.
7. Barker, LA, Harry, JR, and Mercer, JA. Relationships between countermovement jump ground reaction forces and jump height, reactive strength index, and jump time. The Journal of Strength & Conditioning Research 32: 248–254, 2018.
8. Benjanuvatra, N, Lay, BS, Alderson, JA, and Blanksby, BA. Comparison of ground reaction force asymmetry in one-and two-legged countermovement jumps. The Journal of Strength & Conditioning Research 27: 2700–2707, 2013.
9. Berberet, D, Petway, A, Bell, K, Gillen, Z, Mundy, P, Barrera, H, Kabo, J, Walker, D, Medenwald, G, and Welsh, B. Unlocking Basketball Athletic Performance: Countermovement Jump Rebound (CMJ-RE) Normative Reference Values Derived from Force Plate Data Across Seven NCAA Division-I Power Five Men’s College Basketball Teams. International Journal of Strength and Conditioning 5, 2025.
10. Bishop, C, Turner, A, Jarvis, P, Chavda, S, and Read, P. Considerations for selecting field-based strength and power fitness tests to measure asymmetries. The Journal of Strength & Conditioning Research 31: 2635–2644, 2017.
11. Bishop, C, Lake, J, Loturco, I, Papadopoulos, K, Turner, A, and Read, P. Interlimb asymmetries: The need for an individual approach to data analysis. The Journal of Strength & Conditioning Research 35: 695–701, 2021.
12. Bishop, C, Turner, A, Jordan, M, Harry, J, Loturco, I, Lake, J, and Comfort, P. A Framework to Guide Practitioners for Selecting Metrics During the Countermovement and Drop Jump Tests. Strength & Conditioning Journal , 2021.
13. Bishop, C, Jordan, M, Torres-Ronda, L, Loturco, I, Harry, J, Virgile, A, Mundy, P, Turner, A, and Comfort, P. Selecting Metrics That Matter: Comparing the Use of the Countermovement Jump for Performance Profiling, Neuromuscular Fatigue Monitoring, and Injury Rehabilitation Testing. Strength & Conditioning Journal : 10.1519, 2022.
14. Bishop, C, Read, P, Chavda, S, Jarvis, P, Brazier, J, Bromley, T, and Turner, A. Magnitude or direction? Seasonal variation of interlimb asymmetry in elite academy soccer players. Journal of strength and conditioning research 36: 1031–1037, 2022.
15. Bishop, C, Shrier, I, and Jordan, M. Ratio data: Understanding pitfalls and knowing when to standardise. Symmetry 15: 318, 2023.
16. Bobbert, MF, Mackay, M, Schinkelshoek, D, Huijing, PA, and van Ingen Schenau, GJ. Biomechanical analysis of drop and countermovement jumps. Eur. J. Appl. Physiol. Occup. Physiol. 54: 566–573, 1986.
17. Bobbert, MF, Huijing, PA, and van Ingen Schenau, GJ. Drop jumping. I. The influence of jumping technique on the biomechanics of jumping. Medicine & Science in Sports & Exercise 19: 332–338, 1987.
18. Bobbert, MF, Huijing, PA, and Van Ingen Schenau, GJ. Drop jumping. II. The influence of dropping height on the biomechanics of drop jumping. Med. Sci. Sports Exerc. 19: 339–346, 1987.
19. Bobbert, MF, and van Ingen Schenau, GJ. Coordination in vertical jumping. J. Biomech. 21: 249–262, 1988.
20. Bobbert, MF. Drop jumping as a training method for jumping ability. Sports medicine 9: 7–22, 1990.
21. Bobbert, MF, Gerritsen, KG, Litjens, MC, and Van Soest, AJ. Why is countermovement jump height greater than squat jump height? Med. Sci. Sports Exerc. 28: 1402–1412, 1996.
22. Bosco, C, Ito, A, Komi, PV, Luhtanen, P, Rahkila, P, Rusko, H, and Viitasalo, JT. Neuromuscular function and mechanical efficiency of human leg extensor muscles during jumping exercises. Acta Physiol. Scand. 114: 543–550, 1982.
23. Bright, TE, Handford, MJ, Hughes, J, Mundy, PD, Lake, JP, and Doggart, L. Development and reliability of countermovement jump performance in youth athletes at pre-, circa-and post-peak height velocity. , 2023.
24. Bright, TE, Harry, JR, Lake, J, Mundy, P, Theis, N, and Hughes, JD. Methodological considerations in assessing countermovement jumps with handheld accentuated eccentric loading. Sports Biomechanics : 1–18, 2024.
25. Bright, TE, Lake, J, Handford, MJ, Theis, N, Mundy, P, and Hughes, JD. The effects of familiarisation on countermovement jumps with handheld dumbbell accentuated eccentric loading in youth athletes. European Journal of Sport Science 25: e70033, 2025.
26. Bright, TE, Lake, J, Handford, MJ, Theis, N, Ellis, M, Mundy, P, and Hughes, JD. Effects of handheld dumbbell load on force-time characteristics during countermovement jumps with accentuated eccentric loading in youth athletes. Sports Biomechanics : 1–20, 2026.
27. Cabarkapa, DV, Cabarkapa, D, Aleksic, J, Ranisavljev, I, and Fry, AC. Does the short-term learning effect impact vertical jump performance assessment on a portable force plate system? Frontiers in Sports and Active Living 6: 1441022, 2024.
28. Conceição, F, Lewis, M, Lopes, H, and Fonseca, EM. An Evaluation of the Accuracy and Precision of Jump Height Measurements Using Different Technologies and Analytical Methods. Applied Sciences 12: 511, 2022.
29. Cormie, P, McBride, JM, and McCaulley, GO. Power-time, force-time, and velocity-time curve analysis of the countermovement jump: impact of training. The Journal of Strength & Conditioning Research 23: 177–186, 2009.
30. Cormie, P, McGUIGAN, MR, and Newton, RU. Changes in the eccentric phase contribute to improved stretch-shorten cycle performance after training. Med. Sci. Sports Exerc. 42: 1731–1744, 2010.
31. Fahey, J, McMahon, J, and Ripley, NJ. Test Re-test reliability of countermovement jump, single leg countermovement jump, and countermovement rebound jump force plate metrics in female football players: Vertical jump test-rest reliability in female youth football players. International Journal of Strength and Conditioning 4, 2024.
32. Fahey, J, Comfort, P, and Ripley, NJ. Lower limb muscle strength matters: Effect of relative isometric strength on countermovement and rebound jump performance in elite youth female soccer players. Muscles 4: 23, 2025.
33. Flanagan, EP, and Harrison, AJ. Muscle dynamics differences between legs in healthy adults. The Journal of Strength & Conditioning Research 21: 67–72, 2007.
34. Flanagan, EP, Ebben, WP, and Jensen, RL. Reliability of the reactive strength index and time to stabilization during depth jumps. The Journal of Strength & Conditioning Research 22: 1677–1682, 2008.
35. Ghigiarelli, JJ, Saldutti, DV, Pottorf, OA, Sell, KM, and Gonzalez, AM. Individual Monitoring of the Countermovement Rebound Jump in Division I Female Basketball Players Across a Competitive Season: Using the Model Statistic and Coefficient of Variation Approach. The Journal of Strength & Conditioning Research 39: 433–446, 2025.
36. Gillen, ZM, Miramonti, AA, McKay, BD, Leutzinger, TJ, and Cramer, JT. Test-retest reliability and concurrent validity of athletic performance combine tests in 6–15-year-old male athletes. The Journal of Strength & Conditioning Research 32: 2783–2794, 2018.
37. Goldmann, J, Braunstein, B, Heinrich, K, Sanno, M, Stäudle, B, Ritzdorf, W, Brüggemann, G, and Albracht, K. Anonymous Joint work of the take-off leg during elite high jump. In: Proceedings of ISBS-Conference Proceedings Archive. Anonymous , 2015.
38. Harry, JR, Silvernail, JF, Mercer, JA, and Dufek, JS. Comparison of pre-contact joint kinematics and vertical impulse between vertical jump landings and step-off landings from equal heights. Human Movement Science 56: 88–97, 2017.
39. Harry, JR, Silvernail, JF, Mercer, JA, and Dufek, JS. Bilateral comparison of vertical jump landings and step-off landings from equal heights. The Journal of Strength & Conditioning Research 32: 1937–1947, 2018.
40. Harry, JR, Simms, A, and Hite, M. Establishing phase definitions for jump and drop landings and an exploratory assessment of performance-related metrics to monitor during testing. The Journal of Strength & Conditioning Research 38: e62–e71, 2024.
41. Harry, JR, Barker, LA, and Paquette, MR. Sex and acute weighted vest differences in force production and joint work during countermovement vertical jumping. Journal of sports sciences 37: 1318–1326, 2019.
42. Impellizzeri, FM, Rampinini, E, Maffiuletti, N, and Marcora, SM. A vertical jump force test for assessing bilateral strength asymmetry in athletes. Med. Sci. Sports Exerc. 39: 2044, 2007.
43. Klavora, P. Vertical-jump tests: A critical review. Strength and Conditioning Journal 22: 70–75, 2000.
44. Komi, PV. Stretch‐shortening cycle. Strength and power in sport : 184–202, 2003.
45. Krzyszkowski, J, Chowning, LD, and Harry, JR. Phase-Specific Verbal Cue Effects on Countermovement Jump Performance. Journal of strength and conditioning research 36: 3352–3358, 2022.
46. Krzyszkowski, J, Chowning, LD, and Harry, JR. Phase-specific predictors of countermovement jump performance that distinguish good from poor jumpers. Journal of Strength and Conditioning Research 36: 1257–1263, 2022.
47. Lake, J, Mundy, P, Comfort, P, McMahon, JJ, Suchomel, TJ, and Carden, P. Concurrent validity of a portable force plate using vertical jump force–time characteristics. Journal of applied biomechanics 34: 410–413, 2018.
48. Lake, JP, and McMahon, JJ. Within-subject consistency of unimodal and bimodal force application during the countermovement jump. Sports 6: 143, 2018.
49. Lake, JP, Mundy, PD, Comfort, P, McMahon, JJ, Suchomel, TJ, and Carden, P. Effect of barbell load on vertical jump landing force-time characteristics. The Journal of Strength & Conditioning Research 35: 25–32, 2021.
50. Lees, A, Vanrenterghem, J, and De Clercq, D. The maximal and submaximal vertical jump: implications for strength and conditioning. The Journal of Strength & Conditioning Research 18: 787–791, 2004.
51. Linthorne, NP. Analysis of standing vertical jumps using a force platform. American Journal of Physics 69: 1198–1204, 2001.
52. McBride, JM, and Snyder, JG. Mechanical efficiency and force–time curve variation during repetitive jumping in trained and untrained jumpers. Eur. J. Appl. Physiol. 112: 3469–3477, 2012.
53. McBride, JM, and Nimphius, S. Biological system energy algorithm reflected in sub-system joint work distribution movement strategies: influence of strength and eccentric loading. Scientific Reports 10: 1–11, 2020.
54. McMahon, JJ, Murphy, S, Rej, SJ, and Comfort, P. Countermovement-jump-phase characteristics of senior and academy rugby league players. International journal of sports physiology and performance 12: 803–811, 2017.
55. McMahon, JJ, Murphy, S, Rej, SJ, and Comfort, P. Countermovement jump phase characteristics of senior and academy rugby league players. International journal of sports physiology and performance 12: 803–811, 2017.
56. McMahon, JJ, Lake, JP, and Suchomel, TJ. Vertical jump testing. Performance assessment in strength and conditioning Oct: 96–116, 2018.
57. McMahon, JJ, Suchomel, TJ, Lake, JP, and Comfort, P. Understanding the key phases of the countermovement jump force-time curve. Strength & Conditioning Journal 40: 96–106, 2018.
58. McMahon, JJ, Lake, JP, Ripley, NJ, and Comfort, P. Vertical jump testing in rugby league: A rationale for calculating take-off momentum. Journal of Applied Biomechanics 36: 370–374, 2020.
59. Moir, G, Button, C, Glaister, M, and Stone, MH. Influence of familiarization on the reliability of vertical jump and acceleration sprinting performance in physically active men. The Journal of Strength & Conditioning Research 18: 276–280, 2004.
60. Moir, G, Sanders, R, Button, C, and Glaister, M. The influence of familiarization on the reliability of force variables measured during unloaded and loaded vertical jumps. The Journal of Strength & Conditioning Research 19: 140–145, 2005.
61. Moir, GL. Three different methods of calculating vertical jump height from force platform data in men and women. Measurement in Physical Education and Exercise Science 12: 207–218, 2008.
62. Moir, GL, Garcia, A, and Dwyer, GB. Intersession reliability of kinematic and kinetic variables during vertical jumps in men and women. International Journal of Sports Physiology & Performance 4, 2009.
63. Moran, KA, and Wallace, ES. Eccentric loading and range of knee joint motion effects on performance enhancement in vertical jumping. Human Movement Science 26: 824–840, 2007.
64. Nibali, ML, Tombleson, T, Brady, PH, and Wagner, P. Influence of familiarization and competitive level on the reliability of countermovement vertical jump kinetic and kinematic variables. The Journal of Strength & Conditioning Research 29: 2827–2835, 2015.
65. Nicol, C, Avela, J, and Komi, PV. The stretch-shortening cycle: a model to study naturally occurring neuromuscular fatigue. Sports medicine 36: 977–999, 2006.
66. Oliver, JL, Barillas, SR, Lloyd, RS, Moore, I, and Pedley, J. External cueing influences drop jump performance in trained young soccer players. The Journal of Strength & Conditioning Research 35: 1700–1706, 2021.
67. Peng, H, Song, C, Chen, Z, Wang, I, Gu, C, and Wang, L. Differences between bimodal and unimodal force-time curves during countermovement jump. Int. J. Sports Med. 40: 663–669, 2019.
68. Peng, H, Lai, C, Lin, H, and Wang, L. Unimodal and bimodal curves of ground reaction force-time profiles identify the drop jump performance. Sports Biomechanics 23: 3151–3160, 2024.
69. Schmidtbleicher, D. Training for power events. Strength and power in sport 1: 381–395, 1992.
70. Sole, CJ, Mizuguchi, S, Sato, K, Moir, GL, and Stone, MH. Phase characteristics of the countermovement jump force-time curve: A comparison of athletes by jumping ability. The Journal of Strength & Conditioning Research 32: 1155–1165, 2018.
71. Talpey, SW, Drake, M, Haintz, L, Belanger, A, O'Grady, MW, Young, WB, Mundy, PD, James, L, Gabbett, TJ, and Gardner, EC. The Reliability and Validity of the Rebound Countermovement Jump in National Collegiate Athletic Association Division I American Football Players. The Journal of Strength & Conditioning Research : 10.1519, 2022.
72. Turner, AN, and Jeffreys, I. The stretch-shortening cycle: Proposed mechanisms and methods for enhancement. Strength & Conditioning Journal 32: 87–99, 2010.
73. Vanezis, A, and Lees, A. A biomechanical analysis of good and poor performers of the vertical jump. Ergonomics 48: 1594–1603, 2005.
74. Verkhoshansky, Y, and Siff, MC. Supertraining. Verkhoshansky SSTM Rome, 2009.
75. Verkhoshansky, Y, and Verkhoshansky, N. Special Strength Training: Manual for Coaches. Verkhoshansky Sstm Rome, 2011.
76. Vrbik, I, Sporiš, G, Štefan, L, Madić, D, Trajković, N, Valantine, I, and Milanović, Z. The influence of familiarization on physical fitness test results in primary school-aged children. Pediatric exercise science 29: 278–284, 2017.
77. Wade, L, Lichtwark, GA, and Farris, DJ. Comparisons of laboratory‐based methods to calculate jump height and improvements to the field‐based flight‐time method. Scand. J. Med. Sci. Sports 30: 31–37, 2020.
78. Walsh, M, Arampatzis, A, Schade, F, and Brüggemann, G. The effect of drop jump starting height and contact time on power, work performed, and moment of force. The Journal of Strength & Conditioning Research 18: 561–566, 2004.
79. Wilson, JM, and Flanagan, EP. The role of elastic energy in activities with high force and power requirements: a brief review. The Journal of Strength & Conditioning Research 22: 1705–1715, 2008.
80. Wulf, G, and Dufek, JS. Increased jump height with an external focus due to enhanced lower extremity joint kinetics. J. Mot. Behav. 41: 401–409, 2009.
81. Wulf, G, and Lewthwaite, R. Optimizing performance through intrinsic motivation and attention for learning: The OPTIMAL theory of motor learning. Psychon. Bull. Rev. 23: 1382–1414, 2016.
82. Xu, J, Jordan, MJ, Chavda, S, Turner, A, and Bishop, C. Test–Retest Reliability of the Magnitude and Direction of Asymmetry in the Countermovement Jump, Drop Jump, and Countermovement Rebound Jump. Symmetry 15: 1960, 2023.
83. Xu, J, Turner, A, Comfort, P, Harry, JR, McMahon, JJ, Chavda, S, and Bishop, C. A Systematic Review of the Different Calculation Methods for Measuring Jump Height During the Countermovement and Drop Jump Tests. Sports Med 53: 1055–1072, 2023.
84. Xu, J, Turner, A, Comyns, TM, Harry, JR, Chavda, S, and Bishop, C. Countermovement Rebound Jump: A Comparison of Joint Work and Joint Contribution to the Countermovement and Drop Jump Tests. Applied Sciences 13, 2023.
85. Xu, J, Turner, A, Comyns, TM, Chavda, S, and Bishop, C. The Countermovement Rebound Jump: Between-session reliability and a comparison with the countermovement and drop Jump Tests. The Journal of Strength & Conditioning Research : 10.1519, 2023.
86. Xu, J, Turner, A, Comyns, TM, Chavda, S, and Bishop, C. Effects of external verbal cueing on countermovement rebound jump performance. Sports Biomechanics : 1–19, 2024.
87. Xu, J, Turner, A, Jordan, MJ, Comyns, TM, Chavda, S, and Bishop, C. A narrative review of rebound jumping and fast stretch-shortening cycle mechanics. Strength and Conditioning Journal 47: 302–316, 2025.
88. Young, W. Laboratory strength assessment of athletes. New studies in athletics 10: 89, 1995.
89. Young, WB, Pryor, JF, and Wilson, GJ. Countermovement and drop jump performance. Journal of strength and conditioning research 9: 232–236, 1995.

Jiaqing (Jason) Xu is a researcher at the London Sport Institute, Middlesex University. He also provides application support for motion capture systems at Qualisys AB.

Tommy Bright lectures at Plymouth Marjon University as well as being a Strength and Conditioning Consultant for Tournament Golf College. His research focuses on the biomechanics of jumping and athletic performance, with particular expertise in eccentric resistance training and youth athlete development.

John Harry is an Associate Professor of Biomechanics and Director of the Sport and Occupational Neuromechanics Laboratory in the Department of Kinesiology and Sport Management. John’s research interests include the effects of resistance exercise on anxiety-related symptoms, jumping and landing abilities in athletes, load management in resistance exercise and baseball pitching biomechanics.

Chris is an Associate Professor of Strength and Conditioning and the current Head of Department at the London Sport Institute, Middlesex University.
Google Scholar: https://scholar.google.com/citations?user=jep0KcEAAAAJ&hl=en