Markella Koskeridou,1 Andreas Stafylidis1, 2
Affiliations:
1 School of Health & Sport Sciences, Mediterranean College, 21 Ionos Dragoumi St., 54625, Thessaloniki, GREECE - In Partnership with University of Wolverhampton, Wolverhampton WV1 1LY, UK
2 Laboratory of Evaluation of Human Biological Performance, Department of Physical Education and Sports Sciences, Aristotle University of Thessaloniki, 57001 Thessaloniki, GREECE
This study examined the associations between functional movement quality and explosive performance in 53 competitive football players (girls U17, n = 14; women’s first team, n = 26; men’s first team, n = 13), while exploring differences by age, sex and position. Participants completed the Functional Movement Screen (FMS) and three vertical jump tests. Sprint performance (10m and 30m) was also assessed in female cohorts. In addition to the full FMS score, analyses included two modified composite scores isolating lower-body components (mFMS-LB) and lower-body plus trunk stability components (mFMS-LB+T). Women’s first team players were significantly faster than the Girls U17 over 10m (g = 1.86) and 30 m (g = 0.92). FMS scores differed significantly across groups; Girls U17 scored lower than both senior cohorts (g = 1.05–1.08), with no difference between women and men. Men demonstrated the highest jump performance. No positional differences were detected for FMS scores, sprint performance or jump performance. Full FMS scores moderately associated with jump performance (r = 0.33-0.42) and inversely with 30 m sprint time (r = -0.34). The mFMS-LB showed significant associations with 10 m (r = -0.32) and 30 m (r = -0.33) sprints. Conversely, mFMS-LB+T showed the strongest relationships with jump performance (r = 0.35-0.44). In summary, these results suggest that lower-limb mobility relates to acceleration, while combined lower-limb and trunk control may be more relevant to vertical force production.
Football (soccer) is a physically demanding, multidirectional sport characterised by repeated high-intensity actions such as sprinting, accelerating, decelerating, and rapid changes of direction, often performed under physical contact.21 These demands contribute to distinct physical and biomechanical profiles across playing positions, with midfielders typically exhibiting greater endurance due to higher total distance covered, forwards emphasising explosive speed and agility, and defenders relying on strength, positioning, and rapid reactive movements.1, 4 Consequently, positional roles represent an important determinant of physical performance and training needs in football.
The FMS is widely used to assess fundamental movement competency, offering insight into movement quality, potential asymmetries and limitations that may influence both performance and injury risk.24, 36, 37, 45 Analysing associations between FMS scores, athletic performance measures and positional demands may enhance practitioner’s understanding of how movement competency aligns with the sport’s specific physical requirements, if at all.9 Extending this analysis across sex and age groups may also be relevant, as developmental, biomechanical and physiological differences may substantially affect both movement competency and athletic performance outcomes.19
Despite the growing complexity of modern football and the increasing emphasis on individualized training, evidence linking the FMS with key performance indicators - such as sprint speed, agility, and vertical jump - across playing positions remains somewhat limited.27, 51 For example, Kraus et al.27 synthesised 34 FMS-related studies and concluded that, although the FMS can be reliable when administered by experienced raters (> 100 trials), the total composite score has limited capacity to predict athletic performance. Notably, only a subset of the literature addressed performance prediction (12 studies in their review) and much of the available evidence was not designed to test moderation by contextual variables such as positional roles in team sports (e.g., defender vs. midfielder). Consequently, the current knowledge base provides insufficient resolution regarding whether movement-quality-performance relationships are consistent across positions or whether they vary according to the distinct sprint-jump demands of each role. In parallel, Verheul et al.51 highlighted that field-based quantification of biomechanical loads remains challenging and that commonly available monitoring approaches may not capture tissue- and structure-specific loading pathways with sufficient precision. This limitation is highly relevant to positional profiling in football, where between-position differences are expressed through both external performance outputs (e.g., sprinting and jumping) and the underlying mechanical demands that produce them. Collectively, these papers indicate that existing evidence is constrained by i) limited performance-prediction strength for the FMS composite score and ii) methodological barriers to capturing football-relevant mechanical demands in the field, thereby leaving an important gap regarding position-stratified FMS, performance relationships, particularly when also considering sex and age group. Moreover, existing research has not sufficiently examined whether these relationships vary according to sex and age, nor whether positional responsibilities mediate the association between movement quality and performance.2, 14 Previous studies suggest that FMS scores differ across demographic groups 34, 35, 37, 41 yet their direct connection to football-specific physical performance measures is still unclear.
This lack of integrated evidence constrains coaches, sports scientists and rehabilitation professionals in developing evidence-based, position-specific training and injury-prevention strategies. Given that agility, speed and power are critical determinants of football performance12 and that positional roles impose distinct biomechanical and physical demands,11, 43 a comprehensive examination of FMS in relation to performance, position, sex and age is warranted. Accordingly, this study examined the relationships between FMS scores, physical performance outcomes (sprint speed, vertical jump and agility) and playing positions in football, while accounting for sex and age differences. It further explores positional variations in FMS profiles and examines sex- and age-related trends in movement quality, aiming to provide preliminary evidence that may assist practitioners in interpreting movement and performance profiles across competitive groups. In addition, recognising that the FMS comprises distinct movement domains, this study explored whether theory-driven modified composite scores emphasising lower-limb mobility and trunk control demonstrated stronger associations with sprint and jump performance than the full FMS composite score. This secondary objective was designed to examine whether movement tasks more closely related to locomotor and lumbo-pelvic function provide a more performance-relevant representation of movement quality in football.
This study employed a cross-sectional, non-interventional comparative design to examine differences in functional movement quality and physical performance across competitive categories and playing positions in football. Players were stratified by sex/age group (girls U17, women’s first team, men’s first team) and by self-reported primary playing positions (i.e., goalkeeper, defender, midfielder or attacker). Primary outcome variables included FMS scores, modified lower-body (mFMS-LB) and lower-body plus trunk (mFMS-LB+T) composite score, vertical jump performance - squat jump (SJ), countermovement jump with arms locked (CMJ-AL) and countermovement jump with free arms (CMJ-AF) - and linear sprint performance (10m and 30m, where available). Between-group comparisons were conducted across competitive categories and positional subgroups, while correlational analyses examined associations between movement quality and performance measures across the pooled sample. The design was observational in nature and limited to a single testing time point; therefore, analyses were restricted to group comparisons and cross-sectional relationships without inference of causality or training effects.
The sample included 53 competitive football players: Girls U17 (n = 14), Women First Team (n = 26), and Men First Team (n = 13). Participants had a mean age of 19.66 ± 5.20 years (range: 14-33), height of 172.36 ± 8.75 cm, body mass of 64.14 ± 11.29 kg, and 6.62 ± 4.29 years of structured football training (≥ 4 sessions/week). Playing positions comprised of defenders (37.7%), midfielders (28.3%), attackers (26.4%) and goalkeepers (7.5%), with 75.5% right-foot dominant. No participant reported a musculoskeletal injury within the previous six months. All athletes were classified as Tier 3 (Highly Trained/National Level) according to the Participant Classification Framework,38 based on competitive league participation. Inclusion criteria were active competitive participation in the preceding season, regular training (≥ 4 sessions/week), a minimum of five years of club-organised football training, at least one year of structured strength and conditioning training and testing experience. Exclusion criteria included recent lower-limb injury or surgery, current pain or functional limitation, neurological or vestibular disorders and medication affecting neuromuscular function. Participants avoided high-intensity activity for 48 hours prior to testing. The study was non-interventional, approved by the institutional review board (RES2024/016), and conducted with written informed consent (parental consent for minors), with all data anonymised for subsequent analyses.
The study adopted a comparative–analytical design using standardised FMS and physical performance assessments to ensure methodological consistency. Participants were stratified by sex, age, and playing position to examine demographic- and position-specific patterns. All tests were administered by experienced sport scientists with prior certification and practical experience in FMS scoring and performance testing, using standardised instructions, demonstrations and a uniform warm-up protocol to minimise intra- and inter-rater variability. Testing sessions were video recorded for scoring verification and quality control. Players were grouped by self-reported primary playing position (goalkeeper, defender, midfielder, or attacker) and sex/age category for analysis.
Functional movement quality was assessed using the FMS, administered according to standardised, previously published protocols.31, 32, 40 The FMS consists of seven movement tasks (deep squat, hurdle step, in-line lunge, shoulder mobility, active straight leg raise, trunk stability push-up, rotary stability), each scored on a 0–3 ordinal scale (3 = performs movement correctly without compensation; 2 = completes movement with compensation; 1 = unable to complete movement; 0 = pain during movement). For bilateral tests, both sides were assessed and the lower score was retained for subsequent analysis, in accordance with established scoring procedures. Individual task scores were then summed to derive a composite score ranging from 0 to 21. All test set-ups (e.g., hurdle height, tibial-length–based heel-to-toe distance in the in-line lunge) followed standard FMS kit specifications and published administration guidelines.31, 32 Each participant performed three standardised attempts per task (and per side for bilateral tests), with the highest score from the attempts retained for each side. For tests with separate left and right-side scores, the lower score between the left and right sides was then recorded as the final score for that task. The shoulder mobility, trunk stability push-up, and rotary stability tests included their standard clearing screens, whereby any pain reported during the test itself or clearing screen resulted in a score of 0 for that assessment. Subsequent analyses were conducted using the composite FMS score.7, 8, 36
In addition to analyses using the full composite FMS score (0-21), two secondary, theory-driven modified composites were computed to examine whether movement tasks primarily assessing lower-limb mobility and lumbopelvic control demonstrated stronger associations with sprint and jump performance. These modified composites excluded the shoulder mobility task, not because upper-extremity function is irrelevant to sprinting, but because the FMS shoulder mobility screen predominantly evaluates glenohumeral range of motion rather than dynamic arm-swing coordination or force contribution during locomotion. The modified scores were therefore constructed to isolate movement constructs more directly aligned with lower limb force production and propulsion.
The first modified composite, termed the modified lower-body FMS (mFMS-LB; 0-12), included the deep squat, hurdle step, in-line lunge and active straight leg raise. These tasks were selected as they predominantly assess lower-limb mobility, unilateral stability, inter-limb coordination and pelvic control during functional movement patterns. Each task was scored on the standard 0-3 scale and individual scores were summed to produce a composite ranging from 0 to 12, with higher values indicating superior lower-extremity movement quality.
The second modified composite, termed the modified lower-body plus trunk FMS (mFMS-LB+T; 0-18), comprised the four lower-body tasks described above in addition to the trunk stability push-up and rotary stability tests. These additional tasks were included to capture sagittal- and transverse-plane trunk stability and lumbopelvic control, which are theoretically implicated in force transmission and sprint-jump performance. Scores from the six tasks were summed to yield a composite ranging from 0 to 18.
Lower-limb power and sprint ability were assessed using vertical jump and linear sprint tests. Vertical jump height was measured with the My Jump 2 application during the squat jump, countermovement jump with hands on hips (CMJ-AL) and countermovement jump with free arms (CMJ-AF) a method shown to be valid and reliable in various populations.42, 44, 47 The CMJ-AL was included to assess lower-limb power while minimizing the contribution of arm swing, whereas the CMJ-AF reflects a more sport-specific jumping action in which arm swing contributes to impulse generation and superior jump height. Sprint performance was evaluated using a 30 m linear sprint with split times at 10 m and 30 m. Participants performed three maximal sprint trials, each separated by three minutes of passive recovery, with the fastest trial retained for subsequent data analysis. Timing was obtained from 4K (60 fps) video recordings analysed with Kinovea software25, which has been shown to be a valid and reliable method for sprint assessment.10
All trials were video recorded for verification and quality control. Each FMS task was performed for three standardised attempts (and bilaterally where applicable), following detailed verbal instructions and a visual demonstration. The highest score achieved, in accordance with FMS scoring criteria, was retained for analysis. Prior to testing, all participants followed a standardised 10-minute dynamic warm-up consisting of: i) three minutes of low-intensity jogging; ii) dynamic mobility exercises for the hip, knee, and ankle (leg swings, walking lunges, inchworms; 2 × 10 repetitions each); iii) progressive sprint drills (2 × 20m at ~60% and ~80% perceived maximal effort); and iv) two submaximal practice jumps. The warm-up sequence and order were identical for all participants and supervised by the research team to ensure consistency. All participants completed FMS and vertical jump testing; whilst sprint testing was not performed by the men’s team due to logistical constraints.
For performance tests involving multiple trials (sprint and jump assessments), relative reliability was evaluated using two-way random-effects intraclass correlation coefficients (ICC [2,1]) with 95% confidence intervals. Absolute reliability was quantified using the coefficient of variation (CV, %) and standard error of measurement (SEM). ICC values were interpreted as: < 0.50 = poor, 0.50-0.74 = moderate, 0.75-0.89 = good, ≥ 0.90 = excellent reliability.26 Descriptive statistics are reported as mean ± standard deviation (SD), together with 95% confidence intervals (95% CI). Statistical significance was set at p < 0.05. Prior to inferential analyses, assumptions of normality and homogeneity of variances were examined using the Shapiro-Wilk and Levene’s tests, respectively. Sprint performance differences between girls U17 and women’s first team players were analysed using independent-samples t-tests for both 10m and 30m sprint times. Because of unequal group sizes, standardized mean differences were calculated using Hedges g; a bias-corrected estimator of effect size, with corresponding 95% confidence intervals.18, 28 Effect sizes (Hedges g and Pearson’s r) were interpreted using the following magnitude thresholds: < 0.20 = trivial; 0.20–0.49 = small; 0.50.79 = moderate; ≥ 0.80 = large. Comparisons across competitive categories (girls U17, women’s first team, men’s first team) and by playing position, were performed using one-way analyses of variance (ANOVA). 6, 29 When significant main effects were observed, Bonferroni-adjusted post hoc tests were applied. For consistency across analyses, effect sizes for pairwise comparisons were expressed as Hedges g with 95% confidence intervals. Bivariate associations among training experience, FMS composite scores (full and modified), jump performance (countermovement jump with arms free, countermovement jump with arms locked, squat jump), and sprint performance (10m and 30m) were examined using Pearson’s product–moment correlation coefficients. For each association, r values, 95% confidence intervals and p-values were reported. The magnitude of correlations was interpreted using the same thresholds described above (applied to absolute r values). Correlation magnitudes were interpreted using the same thresholds described above (applied to absolute r values) to facilitate consistent interpretation across effect-size families.46, 48
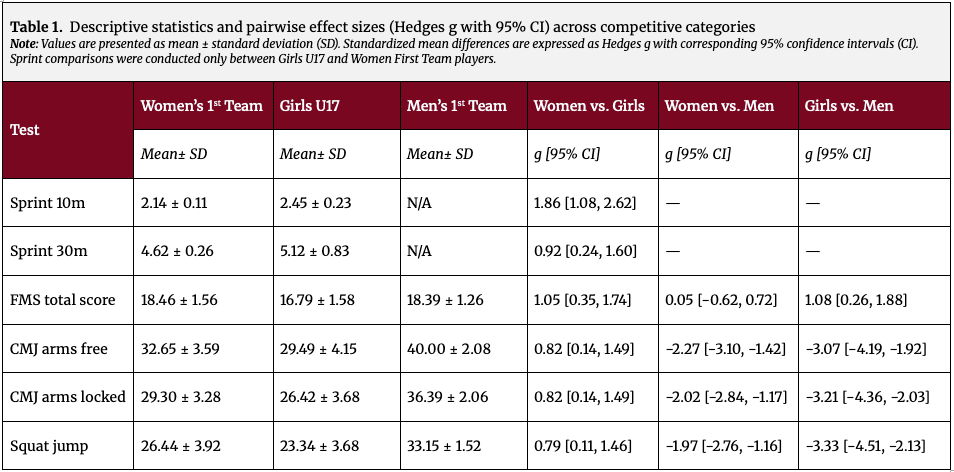
This section reports descriptive and inferential statistics for functional movement quality and performance outcomes across cohorts and where applicable, by playing position. Figures and tables provide full descriptive distributions and group means. A consolidated overview of cohort differences is presented in Table 1. Women’s first team players outperformed the girls U17 in sprint performance (both distances), while the men’s first team players demonstrated the highest jump performance across all jump tests. FMS scores were higher in both senior groups compared to the U17 girls group, with comparable values between women’s and men’s first teams. Sprint comparisons involving men were not possible due to missing sprint data, as outlined in the methods.
Within-session reliability analyses demonstrated acceptable-to-excellent measurement stability across all assessments. The FMS demonstrated good relative reliability (ICC = 0.728, 95% CI [0.337-0.868]), with a CV of 3.25% and a SEM of 0.56 points. Sprint assessments demonstrated near-perfect reliability. The 10m sprint showed an ICC of 0.995 (95% CI [0.975-0.998]), with a CV of 2.61% and an SEM of 0.046s. The 30m sprint also demonstrated near-perfect reliability (ICC = 0.993, 95% CI [0.978-0.997]), with a CV of 3.38% and an SEM of 0.128s. The countermovement jump with arms free exhibited good reliability (ICC = 0.899, 95% CI [0.506-0.961]), with low absolute variability (CV = 2.32%) and an SEM of 0.74cm. Similarly, the countermovement jump with arms locked demonstrated good reliability (ICC = 0.881, 95% CI [0.541-0.950]), with a CV of 3.08% and an SEM of 0.89cm. Finally, the squat jump also showed excellent reliability (ICC = 0.917, 95% CI [0.511-0.970]), accompanied by a CV of 2.04% and an SEM of 0.53cm.
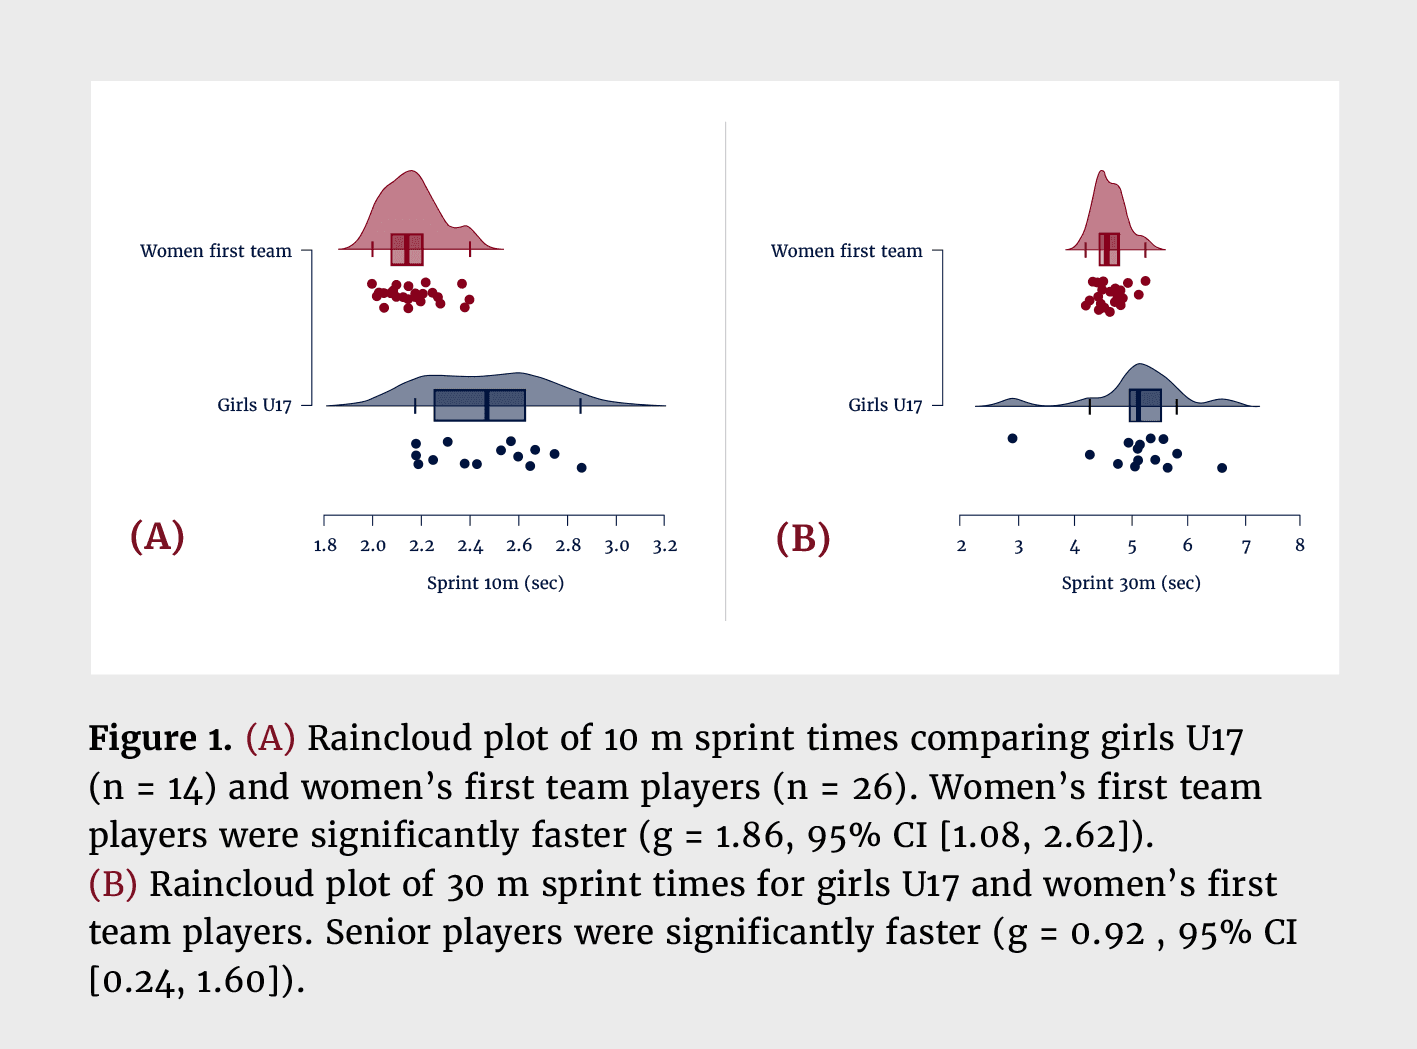
Sprint performance between girls U17 and women’s first team players are shown in Figure 1. For the 10m sprint, women’s first team players were significantly faster than girls U17 players (g = 1.86, 95% CI [1.08, 2.62]. For the 30m sprint, women’s first team players (M = 4.62, SD = 0.26, 95% CI [4.52, 4.72]) also outperformed the U17 group (g = 0.92, 95% CI [0.24, 1.60]).
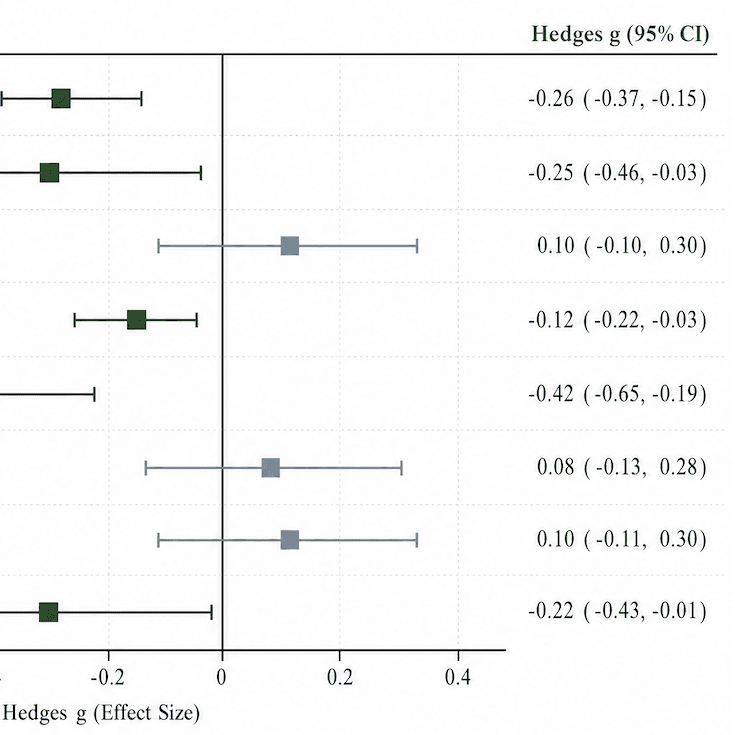
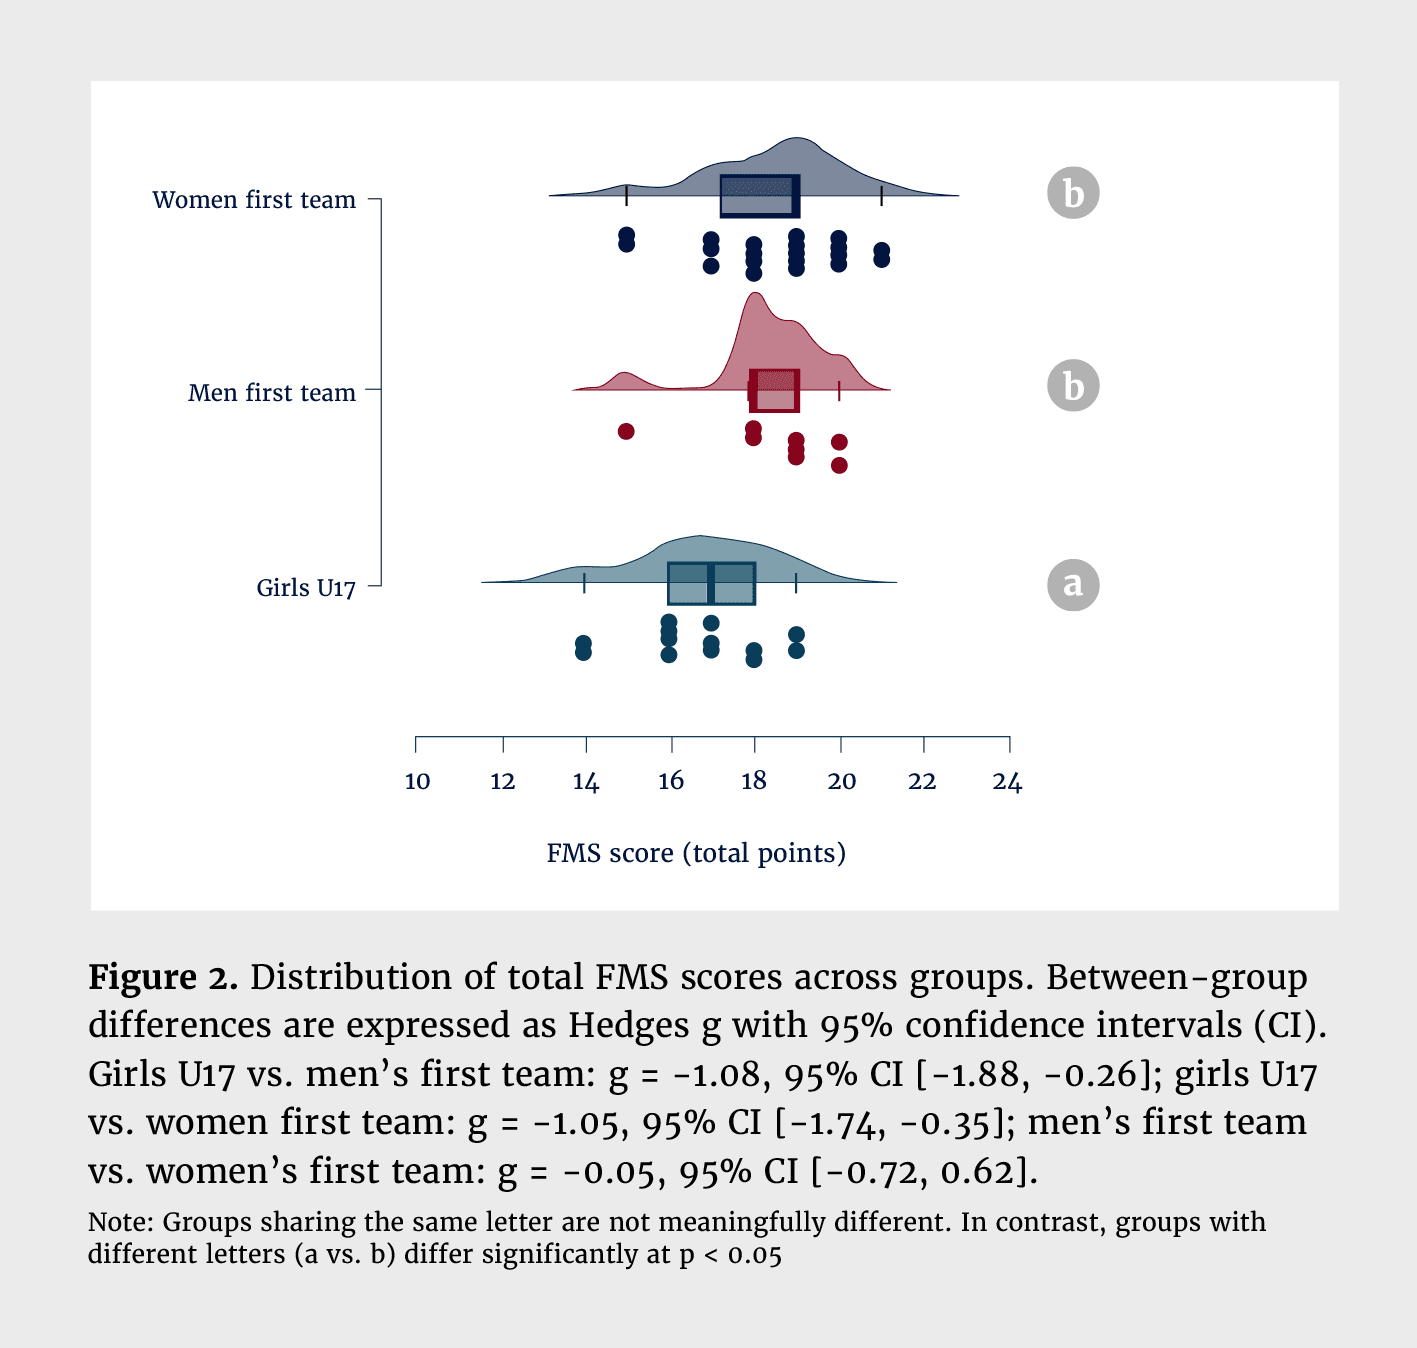
A one-way ANOVA revealed a significant main effect of category on FMS score (total points), F(2, 50) = 6.28, p = .004, η²ₚ = 0.20, 95% CI [0.03, 0.38], (Figure 2). Girls U17 scored significantly lower than the men’s first team (g = -1.08, 95% CI [-1.88, -0.26], and the women’s first team (g = -1.05, 95% CI [-1.74, -0.35]). No difference was observed between men’s and women’s first teams in total FMS score (g = -0.05, 95% CI [-0.72, 0.62]).
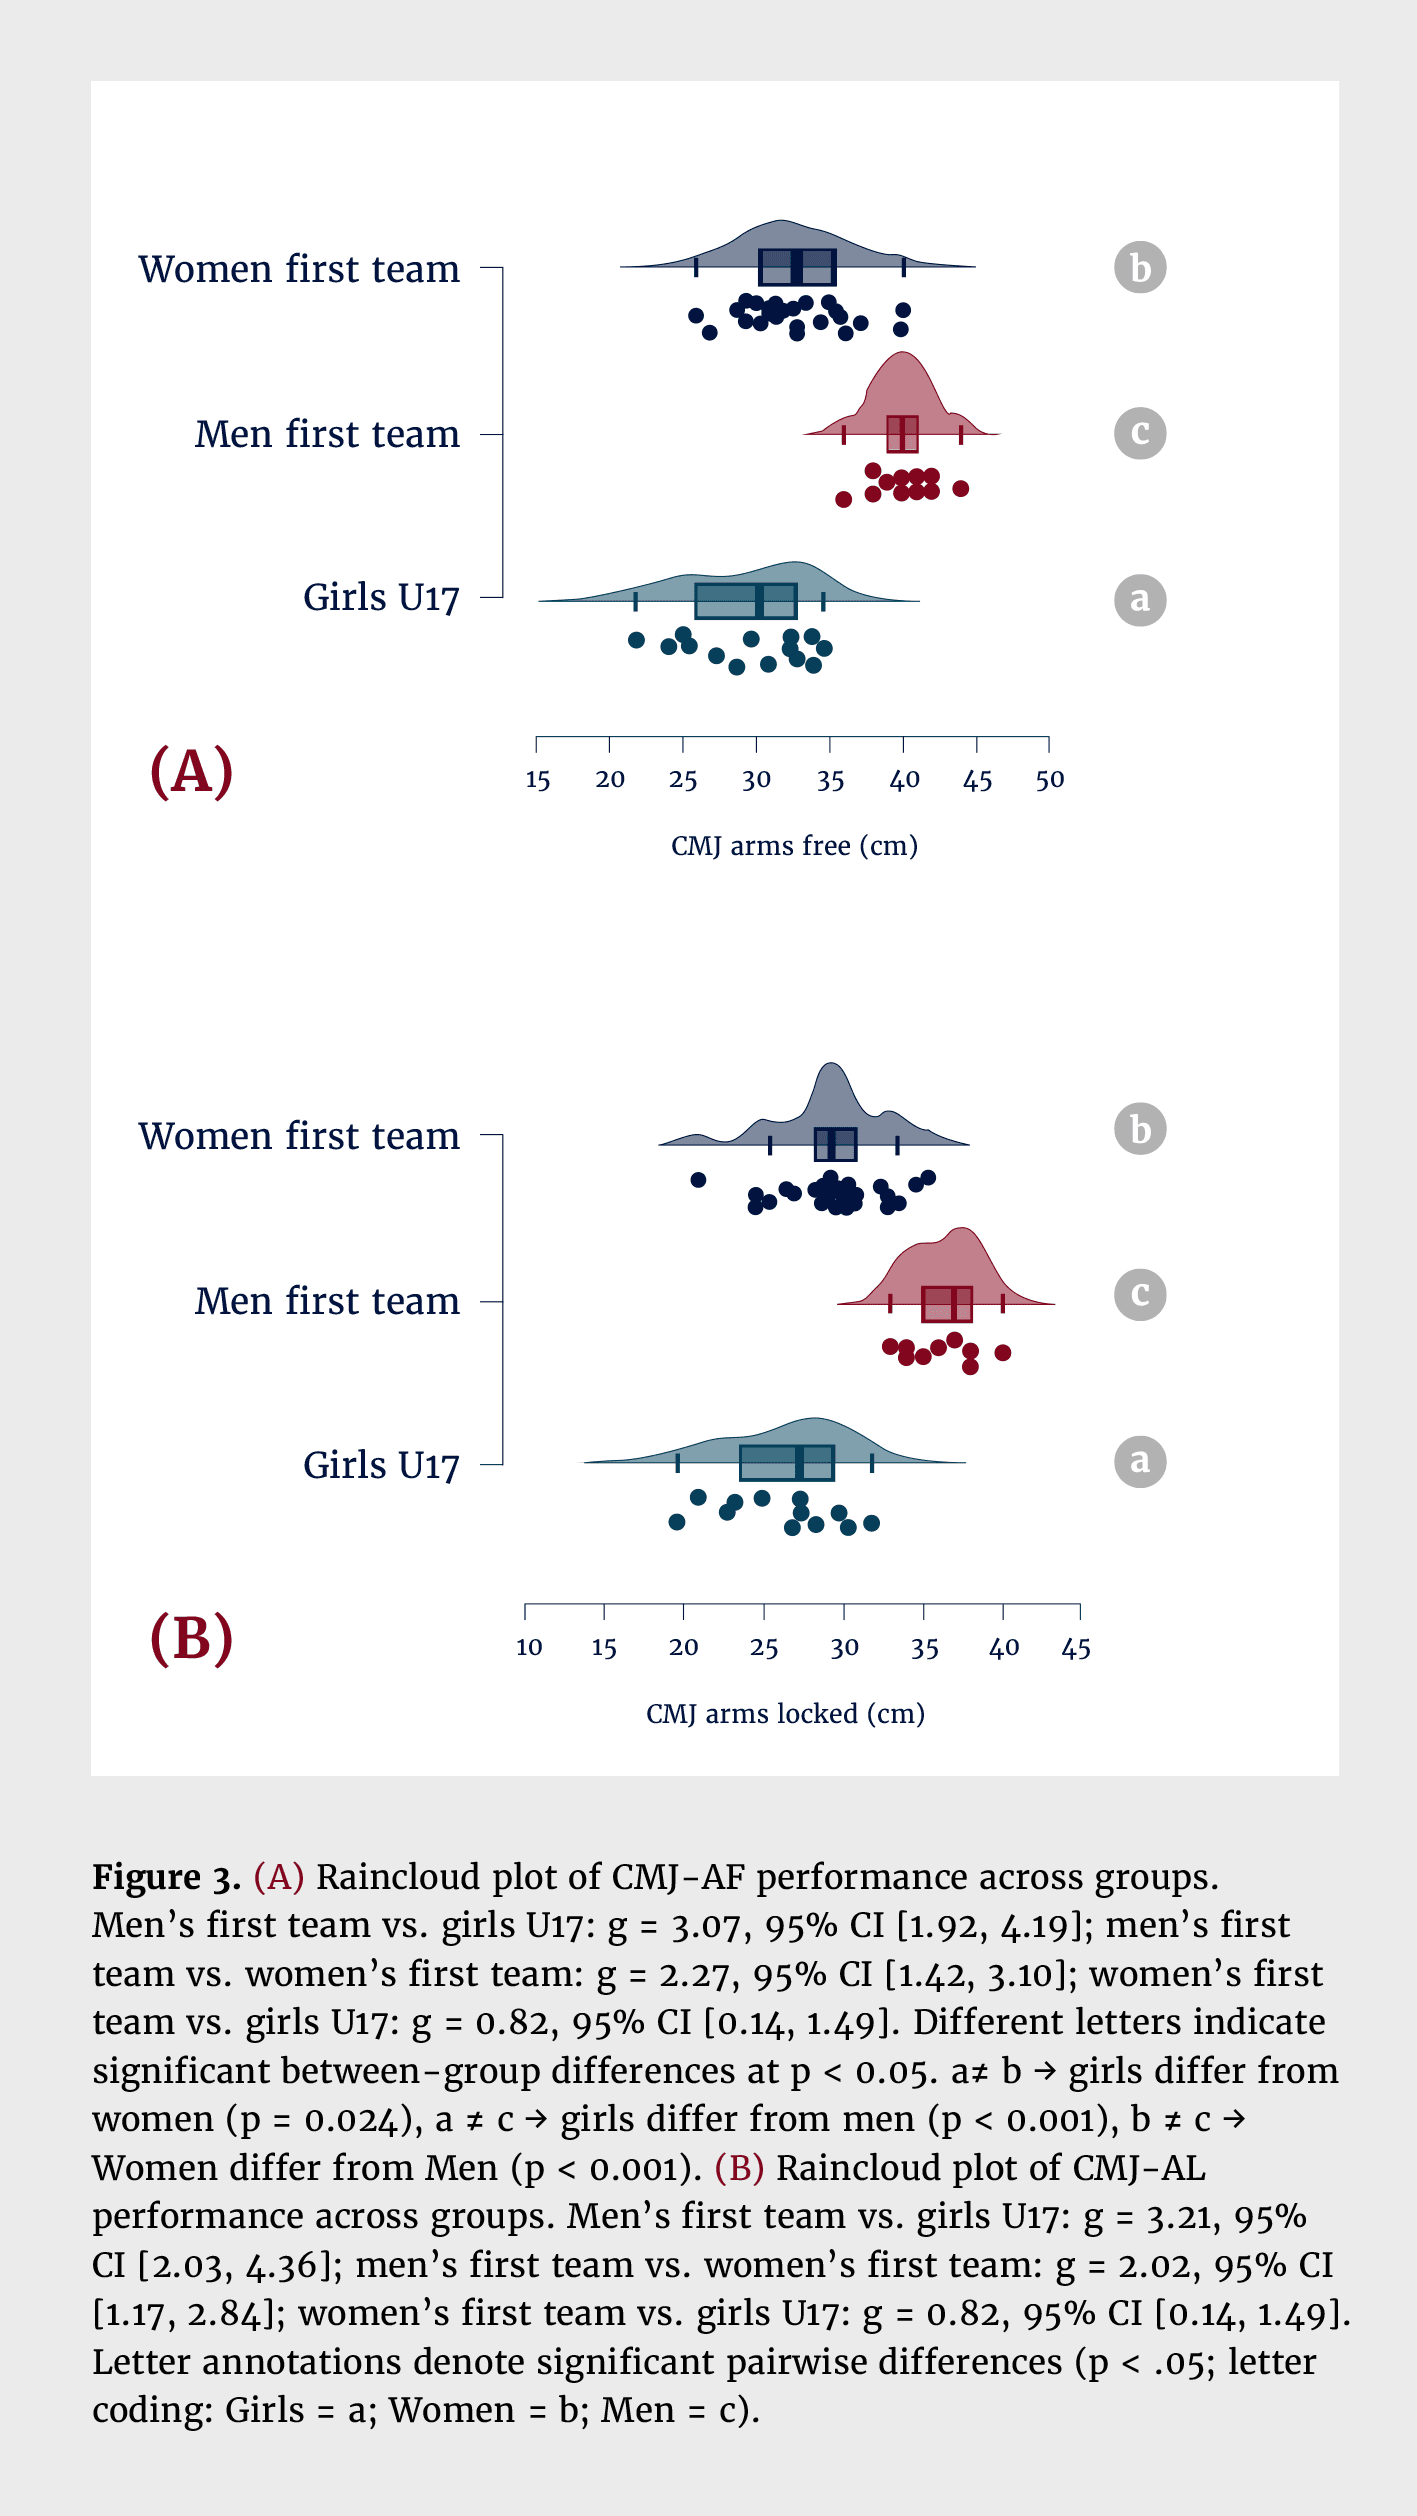
Significant group differences were also observed in jump tests. For CMJ arms free (Figure 3), the ANOVA showed a strong effect of category, F(2, 50) = 33.20, p < .001, η²ₚ = 0.57, 95% CI [0.38, 0.69]. Male players jumped higher than both girls U17 (g = -3.07, 95% CI [-4.19, -1.92]) and the women’s first team (g = 2.27, 95% CI [1.42, 3.10]). In addition, the women’s first team also outperformed the U17 group (g = -0.82, 95% CI [-1.49, -0.14]). For CMJ arms locked, the effect was also significant, F(2, 50) = 36.27, p < .001, η²ₚ = .59, 95% CI [0.41, 0.71]. Male players outperformed both the U17 (g = -3.21, 95% CI [-4.36, -2.03]) and women’s first team groups (g = 2.02, 95% CI [1.17, 2.84]). The women’s first team also jumped significantly higher than the U17 group (g = -0.82, 95% CI [-1.50, -0.14]).
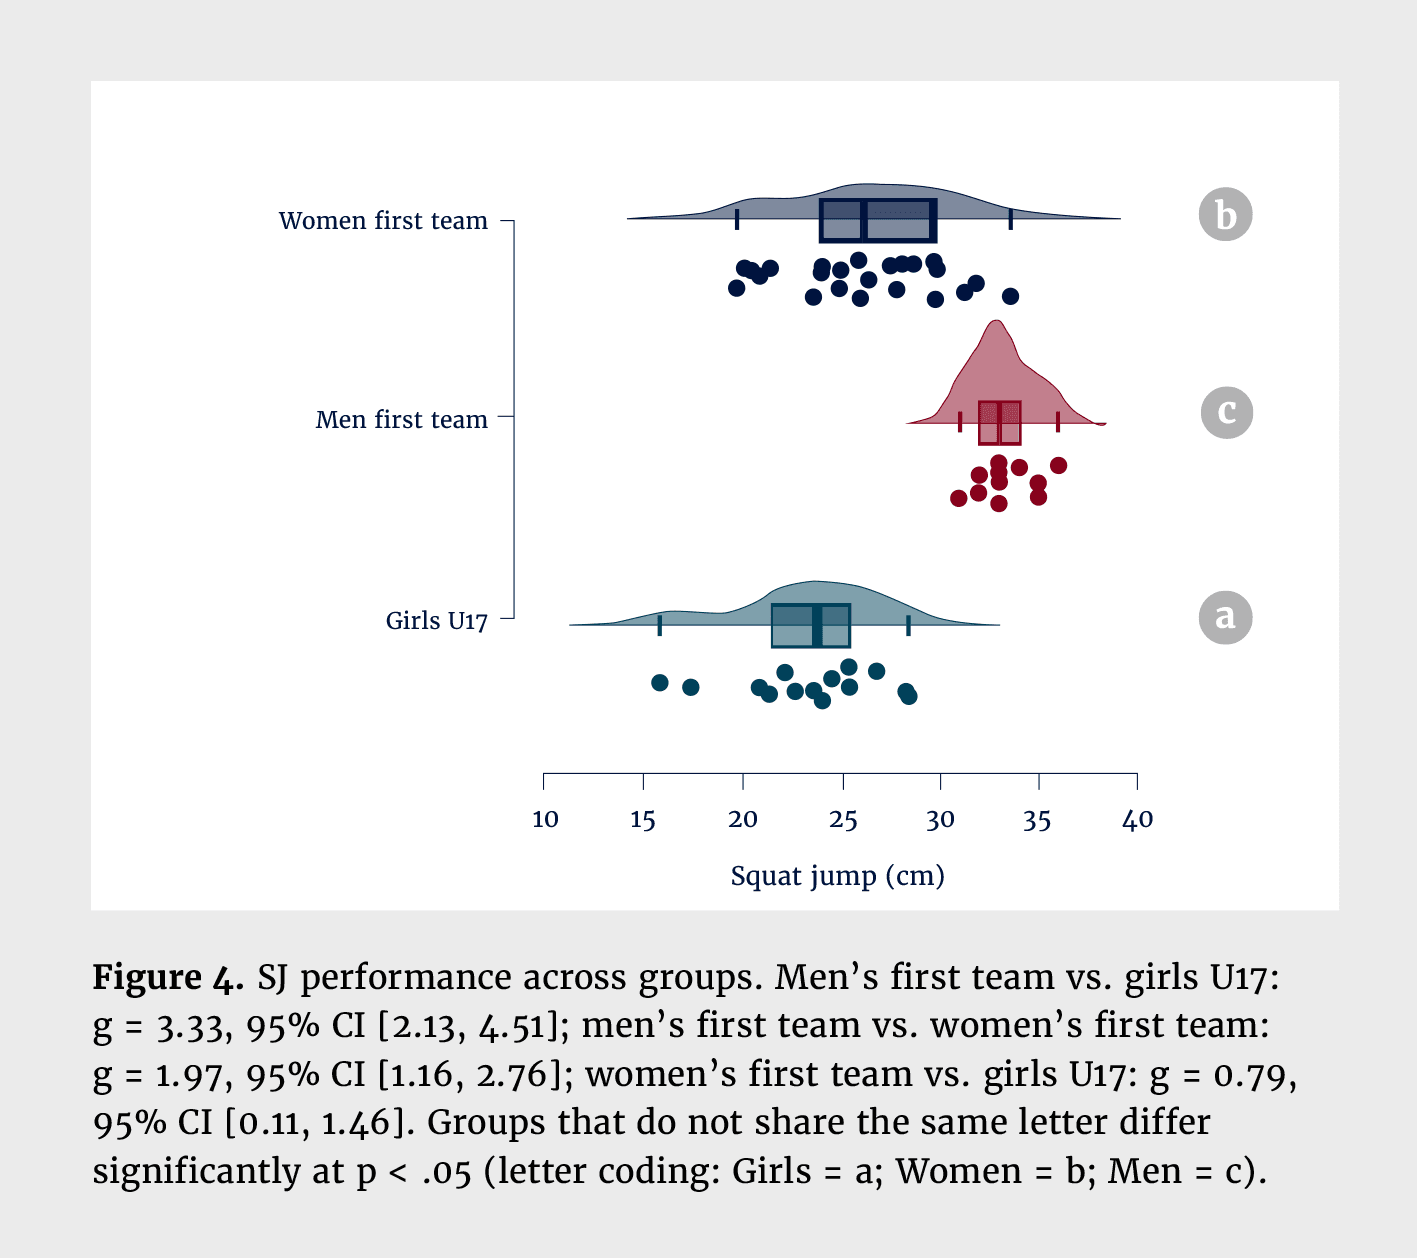
Finally, for the squat jump (Figure 4), the ANOVA indicated a significant effect of category, F (2, 50) = 29.06, p < 0.001, η²ₚ = .54, 95% CI [0.34, 0.67]. Male players outperformed both girls U17 (g = -3.33, 95% CI [-4.51, -2.13]) and the women’s first team (g = 1.97, 95% CI [1.16, 2.76]). Lastly, the women’s first team performed better than the girls U17 group (g = -0.79, 95% CI [-1.46, -0.11]).
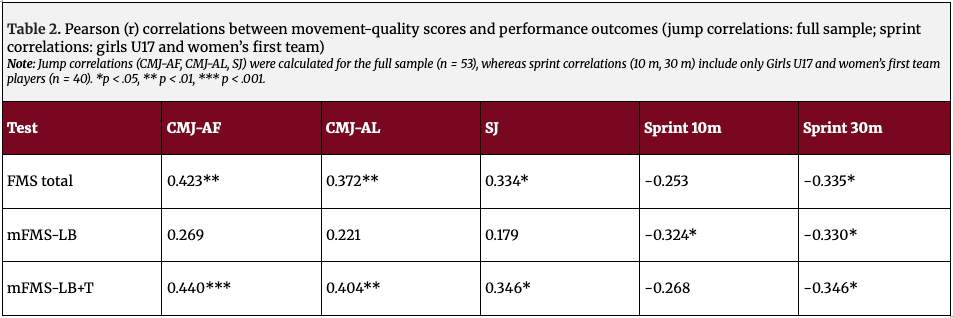
Pearson’s correlation analyses (Table 2) were conducted to examine the relationships between training experience, movement quality (full FMS composite and modified composites), jump performance (CMJ arms free, CMJ arms locked, squat jump) and sprint ability (10m and 30m). Training experience was not significantly correlated with total FMS score (r = 0.22, 95% CI [-0.05, 0.46], p = 0.111) or with any performance outcome (all p > 0.05).
The total FMS score demonstrated moderate positive associations with jump performance. Higher FMS scores were associated with greater CMJ arms free (r = 0.423, 95% CI [0.173, 0.623], p = 0.002), CMJ arms locked (r = 0.372, 95% CI [0.113, 0.583], p = 0.006) and squat jump height (r = 0.334, 95% CI [0.070, 0.554], p = 0.015). A significant negative association was observed with 30m sprint time (r = -0.335, 95% CI [-0.586, - 0.027], p = 0.034), indicating that higher movement quality was related to faster sprint performance. The relationship with 10m sprint time did not reach statistical significance (r = -0.253, 95% CI [-0.523, 0.063], p = 0.115).
The lower-body composite showed small-to-moderate but largely non-significant associations with jump performance: CMJ arms free (r = 0.269, 95% CI [-0.002, 0.502], p = 0.052), CMJ arms locked (r = 0.221, 95% CI [-0.052, 0.464], p = 0.111) and squat jump (r = 0.179, 95% CI [-0.096, 0.429], p = 0.199). However, mFMS-LB demonstrated a significant moderate negative association with 10m sprint time (r = -0.324, 95% CI [-0.577, -0.014], p = 0.042) and with 30m sprint time (r = -0.330, 95% CI [-0.582, -0.021], p = 0.038).
When trunk stability tasks were incorporated, associations with jump performance strengthened relative to the lower-body-only composite. The mFMS-LB+T composite was positively associated with CMJ arms free (r = 0.440, 95% CI [0.192, 0.635], p < 0.001), CMJ arms locked (r = 0.404, 95% CI [0.150, 0.608], p = 0.003), and squat jump (r = 0.346, 95% CI [0.083, 0.563], p = 0.011). Significant negative associations were observed with 30m sprint time (r = -0.346, 95% CI [-0.593, -0.038], p = 0.029), whereas the relationship with 10m sprint time did not reach statistical significance (r = -0.268, 95% CI [-0.535, 0.047], p = 0.094).
Pearson correlation analyses were conducted to examine the relationships between movement-quality indices and performance outcomes. The total FMS score demonstrated moderate positive associations with vertical jump performance and a moderate negative association with 30 m sprint time, indicating that higher movement-quality scores were generally associated with greater jump height and faster sprint performance. The modified lower-body composite (mFMS-LB) showed significant associations with both 10m and 30m sprint performance. In contrast, the modified lower-body plus trunk composite (mFMS-LB+T) demonstrated the strongest associations with vertical jump outcomes. Overall, these findings indicate that lower-limb mobility appears more closely related to sprint acceleration, whereas the inclusion of trunk stability components may be more relevant to vertical force production.
Within-cohort analyses revealed no statistically significant positional differences in FMS scores, sprint performance or jump outcomes in any of the groups. In the women’s first team, mean values were comparable across attackers, defenders, midfielders and goalkeepers for all performance and movement variables. Similarly, no positional differences were detected in the girls U17 cohort. Although attackers demonstrated numerically higher jump performance and faster sprint times in some comparisons, these differences did not reach statistical significance. In the men’s first team, no meaningful positional variation was observed for FMS or performance outcomes. Goalkeepers were excluded from positional analyses due to insufficient sample size. Overall, findings suggest that within-cohort positional differences in movement quality and physical performance were minimal in the present sample.
The present study demonstrated that age and sex exert a stronger influence on functional movement quality and physical performance than playing position during the early preseason. Senior players outperformed youth players and men exhibited superior jump performance compared to women, consistent with established differences in biological maturity, hormonal profiles and neuromuscular development. In contrast, positional differences were minimal across all cohorts. This likely reflects the standardised nature of preseason training, during which conditioning loads are largely uniform across positions, as well as limited statistical power when performing subgroup analyses. The absence of sprint data in the men’s team further constrained positional comparisons and highlights the importance of aligning data collection with training schedules, where possible.
Sex-related differences in sprint and jump performance are well-documented and can be explained by physiological mechanisms. Higher circulating testosterone levels in men facilitate greater muscle hypertrophy and power output,15 alongside a higher proportion of type II muscle fibres that support explosive actions.20, 40 Women, while generally producing lower peak power, often display greater resistance to fatigue, potentially due to differences in fibre-type distribution and oxidative capacity.53 Age-related differences similarly reflect biological maturation processes, with adolescence characterised by rapid increases in muscle cross-sectional area, neural drive and motor unit recruitment.13, 22 These adaptations, combined with accumulated training exposure, help explain the superior performance of senior players relative to youth athletes.31
Beyond group comparisons, the findings emphasise the importance of aligning physical testing with developmental stage and performance objectives. In youth players, sprint and jump assessments can provide indirect insight into biological maturation and readiness for higher training loads.30 In senior players, benchmarking against established reference values can help identify specific performance deficits, particularly in speed and explosive power. Functional movement assessments complement these tests by identifying movement limitations that may restrict performance or increase injury risk, supporting a more holistic approach to athlete monitoring.
FMS scores showed moderate associations with sprint and jump performance (r = 0.33-0.42), suggesting that movement quality moderately contributes to explosive physical capacities. Previous research also suggests that movement asymmetries or dysfunctional patterns identified through individual FMS tests may be more informative than the composite score alone, with athletes displaying such deficits showing a substantially greater likelihood of musculoskeletal injury.39 In addition, the FMS has been proposed as a multidimensional screening tool capable of identifying dysfunctional movement patterns and asymmetries arising from deficits in mobility, stability, coordination and neuromuscular control, thereby providing practitioners with a broader profile of motor competency beyond traditional performance tests.50 However, it is unlikely that all FMS components contributed equally to these relationships. Previous research indicates that specific subtests, such as the deep squat, hurdle step and rotary stability, are more directly related to sprinting and jumping due to their assessment of lower-limb mobility, dynamic stability and trunk control.5, 23, 49 Evidence from female team-sport athletes further suggests that individual FMS components such as the active straight-leg raise, hurdle step and in-line lunge may demonstrate task-specific relationships with physical performance measures.33 Empirical evidence supports this perspective, with moderate correlations reported between hurdle step performance and sprint speed and between trunk stability and change-of-direction ability.45, 54 To examine this premise, the present study compared the full FMS composite with theory-driven modified composites isolating lower-body and trunk-related components. The pattern of results only partially supported this rationale: trunk-inclusive scores demonstrated slightly stronger associations with vertical jump performance, whereas lower-body components were more closely aligned with short-distance sprint acceleration. Importantly, differences in magnitude were modest, indicating that while certain movement domains may show greater task specificity, the global FMS composite captures broadly relevant movement constructs. These findings may suggest that selective FMS composites may offer some targeted insight into specific performance qualities, although the full composite remains informative within a multidimensional profiling framework.
Within-group analyses revealed no significant positional differences in FMS, sprint or jump performance across women, girls or men. This finding contrasts with match-play studies that consistently report positional differences in high-intensity running and sprint demands.3, 11, 52 The discrepancy likely arises from methodological context: preseason testing captures general physical capacities under controlled conditions, whereas match analyses reflect position-specific tactical demands. Thus, the lack of positional differentiation observed here may be specific to the preseason phase rather than indicative of true equivalence during competition.
The practical relevance of the observed between-group differences is reinforced when considered alongside minimal clinically important differences and benchmark values. Improvements of 0.05-0.10s over 10m are considered meaningful in football performance16, 17 and the approximately 0.4-0.5s difference in 30m sprint performance between senior women and U17 girls clearly exceeds this threshold. Between-group differences in squat and CMJ height were moderate to large in magnitude when expressed as absolute effect sizes (|g| range = 0.79-3.33). Negative values reported in Table 1 reflect the direction of the pairwise comparisons rather than the magnitude of the effect. For example, the comparison between women’s and men’s first teams in CMJ arms free yielded an effect size of g = -2.27, indicating superior jump performance in the men’s team; the absolute magnitude of this effect (g = 2.27) represents a large difference. Additionally, movement-quality scores were moderately associated with both jump and sprint performance, suggesting that the observed differences are likely to be practically meaningful for explosive football actions. Comparisons with published reference values further suggest that the sample reflects sub-elite performance levels, particularly in sprinting, highlighting the need for targeted speed development. 3, 11, 43
Several limitations should be acknowledged in the present study. Uneven subgroup representation, including the absence of a men’s goalkeeper and unbalanced positional groups, limit the generalisability of our findings. Sprint testing was not conducted in the men’s team, and the use of field-based tools may have resulted in heightened measurement variability compared with laboratory systems. The cross-sectional design restricts causal inference, while the exclusion of multidirectional performance measures constrains the evaluation of football-specific demands. Potential sources of bias include self-reported positional data and the subjective nature of FMS scoring. Although Bonferroni-adjusted post hoc tests and effect size reporting were applied where appropriate, the number of statistical comparisons, particularly in positional and correlational analyses, may increase the likelihood of chance findings. Uncontrolled confounders such as training load, fatigue and menstrual cycle phase, may also have influenced results. Finally, the absence of in-match performance data limits ecological validity. Future research should adopt longitudinal, multi-centre designs with balanced cohorts, integrate objective biomechanical and GPS-derived measures and examine individual FMS components to enhance translational relevance.
The present findings indicate that movement-quality assessment may provide practitioners with additional information when monitoring physical performance in football players. Integrating the FMS protocol alongside traditional sprint and jump assessments can help practitioners identify mobility restrictions, asymmetries, or compensatory movement strategies that may influence how force is produced during football-specific actions such as acceleration, sprinting and jumping. Rather than replacing established performance testing, the FMS may be used as a complementary diagnostic tool within routine monitoring frameworks to assist coaches in interpreting changes in neuromuscular performance across the season. From a practical standpoint, movement-screening outcomes may guide targeted interventions within weekly strength and conditioning sessions. For example, when deficits in lower-limb mobility or trunk control are detected, practitioners may prioritise exercises aimed at improving hip mobility, unilateral strength and lumbopelvic stability. These physical qualities are considered important for efficient force transfer during explosive football actions, including sprint acceleration and vertical jumping. In addition, individual movement limitations identified through screening can inform the prescription of corrective or preparatory exercises within warm-up routines or supplementary training blocks. Regular monitoring may therefore assist practitioners in identifying emerging movement limitations, adjusting training content or load and informing return-to-play strategies following injury. Collectively, combining movement-quality screening with performance testing may allow coaches to refine training prescription and better individualise physical preparation in football environments.

Markella holds a master’s degree in Strength and Conditioning from the School of Health and Sport Sciences, Mediterranean College, Thessaloniki, Greece in collaboration with the University of Wolverhampton. She is a professional football (soccer) player for PAOK FC and the Greek National Team and serves as a coach for elite youth players (U15), contributing to athlete development and performance training.

Andreas is based at the School of Health and Sports Sciences, Mediterranean College, Thessaloniki, Greece and is currently in collaboration with the University of Wolverhampton, where he teaches Research Methods and Athlete Profiling. He is currently completing his PhD in Physical Education and Sport Science at the Aristotle University of Thessaloniki (AUTH), focusing on mental and physical performance and fatigue in professional football players.
Email: a.stafylidis@mc-class.gr