By Dan Richmond,1 Shyam Chavda,1 Anthony Turner,1 Chris Bishop1
Affiliations:
The aim of this study was to assess the within and between‑session reliability of the countermovement jump (CMJ), squat jump (SJ), drop jump (DJ), and 10‑5 repeated jumps (10‑5), in youth athletes using an Output Sports movement sensor. Thirty‑one participants (23 female, 8 male; mean age = 15 ± 0.7 years) performed three maximal trials of each test during two separate data collections sessions separated by seven days. CMJ height showed excellent within‑session reliability (session 1: ICC = 0.92, CV = 5%; session 2: ICC = 0.95, CV = 4%) and excellent between‑session reliability (ICC = 0.92, CV = 4%). SJ height demonstrated good‑to‑excellent within‑session reliability (session 1: ICC = 0.84, CV = 5%; session 2: ICC = 0.91, CV = 5%) and excellent between‑session reliability (ICC = 0.91, CV = 5%). For the DJ, within‑session reliability was moderate-to-excellent with moderate to high variability for jump height (JH) (session 1: ICC = 0.74, CV = 11%; session 2: ICC = 0.75, CV = 8%) contact time (CT) (session 1: ICC = 0.89, CV = 11%; session 2: ICC = 0.82, CV = 11%) and reactive strength index (RSI) (session 1: ICC = 0.92, CV = 12%; session 2: ICC = 0.69, CV = 14%). Between‑session reliability for the DJ ranged from moderate to good, alongside moderate to high variability for JH (ICC = 0.80, CV = 9%), CT (ICC = 0.62, CV = 11%), and RSI (ICC = 0.86, CV = 13%). For the 10‑5 test, within‑session reliability ranged from good-to-excellent, with moderate-to-poor variability for JH (session 1: ICC 0.68, CV = 10%, session 2: ICC = 0.84, CV = 7%) CT (session 1: ICC = 0.79, CV = 5%; session 2: ICC = 0.75, CV = 5%) and RSI (session 1: ICC = 0.89, CV = 7%; session 2: ICC = 0.90, CV = 7%). Between‑session reliability for the 10‑5 ranged from moderate to good, alongside moderate variability for JH (ICC = 0.83, CV = 8%), CT (ICC = 0.57, CV = 5%), and RSI (ICC = 0.85, CV = 7%). Finally, significant negative decreases were observed for CMJ height (g = -0.26; p < 0.05), SJ height (g = -0.25; p < 0.05), DJ height (g = - 0.12; p < 0.05), DJ CT (g = -0.42; p < 0.05), and 10‑5 CT (g = -0.22; p < 0.05). For the most part, practitioners can consider these four jump tests reliable when using the Output sensor, although some additional familiarisation and attention to coaching detail may be required for the DJ.
Muscular strength and power are two central health-related attributes relating to overall physical fitness,5 which can be objectively measured through laboratory and field-based testing.26 Within the school or college setting, standardised field-testing protocols such as the cooper test,9 the 20m shuttle run20 and sit-and-reach test33 have been widely researched and utilised. To date, research has established the countermovement jump (CMJ) and squat jump (SJ) as reliable jump tests when assessing jump height (JH) in youth populations.24 The drop jump (DJ) and 10-5 repeated jump tests (10-5) have also been highlighted as reliable tests to quantify the reactive strength index (RSI); calculated as JH ÷ contact time (CT). Due to the nature of this ratio metric, caution must be taken by practitioners when interpreting RSI values without inspecting each component part, as athletes may change their jump strategy to reduce CT at the expense of JH, in an attempt to maximise RSI.14
Vertical jumping is a multi-joint action that requires complex motor coordination16 and has been widely utilised to assess an individual’s lower limb neuromuscular capacity.22 This is, in part, due to the simplicity of procedures, time-efficient nature of testing and depth of information that can be obtained from jump testing.21 Due to the pervasiveness of vertical jump testing, it remains important to quantify the reliability of various measurement devices and corresponding methods of testing. The use of force platforms and contact mats remain at the forefront of jump testing.18 However, the large costs associated with these pieces of equipment and the training needed to operate them make them unavailable for some practitioners. The development of more cost-efficient and simplistic devices, such as the Vertec and Just Jump systems have all demonstrated acceptable reliability when assessing JH.17, 35 However, these systems have been shown to be sensitive to changes in technique, such as arm swing and take-off mechanics, which in turn, can inflate JH scores.27 More recently, Output Sports movement sensors are inertial measurement units (IMU) that measure the dynamic motion of a person or object, by providing data on linear acceleration, angular velocity and orientation.32 Research using optical timing systems and IMUs remain sparce,6 but existing literature suggests they may be a suitable alternative for assessing jumping performance.
Research has shown a near-perfect positive correlation of r = 0.98 between force plates and the Output Sports movement sensor,8 indicating the movement sensor may be a suitable alternative for measuring JH during the CMJ. JH was collected simultaneously on both devices and calculated from the flight time (FT) data using the equation JH = (9.81 x FT²)/8.3 Another study29 reported the intraclass correlation coefficient (ICC) for the DJ, which showed moderate to excellent relative reliability for metrics such as: CT (ICC = 0.83), JH (ICC = 0.92) and RSI (ICC = 0.77), suggesting that the sensors may be an acceptable alternative tool during the assessment of fast SSC muscle actions. However, beyond this research8, 29 few researchers have examined the consistency and reliability of the CMJ, SJ, DJ and 10-5 jump tests using Output Sport movement sensors, leaving uncertainty as to whether the data they generate accurately reflects jump performance and changes that may occur both within and between sessions. Further to this, to the best of the author team’s knowledge, there have been no test-retest study designs using this technology; thus, at present, practitioners have no comprehension of the typical day-to-day measurement error associated with these commonly used jump assessments. Accordingly, the primary aim of this study was to assess both the within session and between session reliability of four commonly used jump tests – namely the CMJ, SJ, DJ, and 10-5 protocol.
A repeated measures design was utilised to investigate the test-retest reliability of four jump tests using the Output Sports movement sensors, with data collection sessions separated by one week. During each session, three trials of the CMJ, SJ, DJ, and 10-5 tests were completed. All subjects were familiar with the appropriate technique required for each test, having been previously tested as part of their respective sporting programmes. All testing sessions recorded the JH from each test, but also CT and RSI for the DJ and 10-5 protocol. The sensors had identical positioning on the top of the foot as suggested by Output Sports, with technical instructions and video demonstrations that all participants watched. Test orders were randomised in each session to minimise any potential learning effects.30 All subjects completed the warm-up protocol (outlined later), familiarisation jumps and data collection within 45 minutes for a given test session.
A convenience sample of 31 physically active female (n = 23; age = 15 ± 0.7 years; height = 163 ± 7 cm; body mass = 58 ± 10 kg) and male (n = 8; age = 15 ± 0.7 years; height = 172 ± 8 cm; body mass = 58 ± 7 kg) recreational youth athletes volunteered for this study. In line with suggestions a sample of 31 was required if the true ICC was expected to be 0.9, with 50% probability of obtaining the desired precision and with the width of the confidence interval (CI) set at 0.15.2 The inclusion criteria required participants to be aged between 12 and 16 years old, enrolled in full time education on the Isle of Man (IOM) and be free from injury, illness and/or disease. They were also actively participating in either the Isle of Man Sport Performance Development Pathway (IOMPDP) or Isle of Man Sport Aid Academy (IOMSAA) programmes, at the time of the study. Participants were contacted via email and provided with written guidance surrounding the purpose and procedures involved in the study, alongside any potential side effects of taking part. Participants were required to return informed consent and PAR-Q forms, alongside a signed parental consent form if they wished to be included in the study, given they were all under 18 years of age. Ethical approval was granted from the London Sport Institute research and ethics committee at Middlesex University.
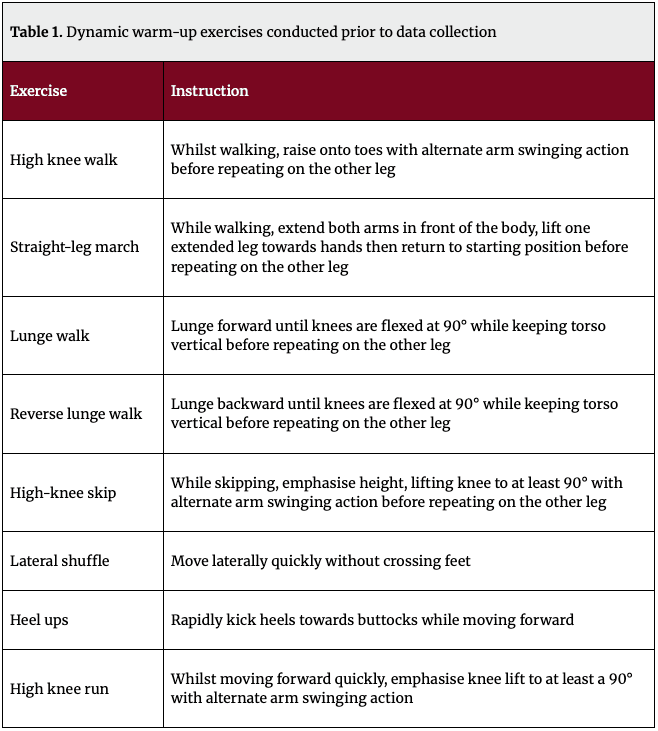
Before all testing sessions, participants completed the same 10-minute dynamic warm-up, consisting of a series of dynamic stretches that progressed from ‘low’ to ‘moderate’ intensity (Table 1). Participants performed each exercise over a 12-metre distance, rested for 10 seconds, then repeated the same exercise back towards their starting position. Of note, these dynamic stretches have been widely used within the existing youth physical testing literature.10, 12, 13
On completion of the warm-up protocol, participants walked for two minutes prior to jump testing to ensure adherence to the protocol utilised.12 A video demonstration of each jump test, alongside verbal instructions provided by Output Sports detailing how to perform each jump test, were then given to participants. Following this, each participant was given five minutes to familiarise themselves with each jump before testing commenced.8 As part of this familiarisation process, participants practiced each jump approximately three times at an escalating perceived level of intensity. Participants then completed three maximal effort CMJ, SJ and DJ trials and 11 maximal effort repeated jumps for the 10-5 protocol, with hands always positioned on the hips. Each trial was followed by a 90 second rest period, in addition to three minutes of rest between tests – all of which was timed by the lead facilitator. Prior to each trial, one sensor was placed vertically on the right foot of each participant by the facilitator, as suggested by Output Sports.
Participants were given the following verbal instructions for the CMJ: “Begin with feet hip width apart with hands on hips, bend at the hips and knees then jump as high as possible keeping your legs straight and hands on hips before re-bending the hips and knees to land. Return to starting position to finish trial”. The JH of each trial was recorded with an average of all trials used for subsequent data analysis.
Participants were given the following verbal instructions for the SJ: “Begin in a squat position with feet hip width apart and hands on hips, jump as high as possible keeping your legs straight and hands on hips before re-bending knees and hips in preparation for landing. Then return to starting upright position”. The JH of each trial was recorded with an average of all trials used for subsequent data analysis.
Participants were given the following verbal instructions for the DJ: “Stand on a 30cm box with hands on hips, step forward off the box landing on the floor with both feet before immediately completing a maximal effort vertical jump reacting as fast as possible with hands remaining on the hips. Re-bend the knees and hips in preparation for landing on the floor in a strong position”. The JH, CT and RSI of each trial were recorded with an average of all trials used for subsequent data analysis.
Participants were given the following verbal instructions for the 10-5: “Begin with feet hip width apart and hands on the hips before completing 11 consecutive jumps in rapid succession, keeping legs straight in the air with hands on the hips, before a slight bend on knees upon landing whilst ensuring ground contacts remain as quick as possible”. It was encouraged that participants keep jumping until they are told to rest and do not attempt to count the number of jumps during each trial to ensure an accurate number of repetitions were performed. The JH, GCT and RSI of each trial were recorded with an average of all trials used for subsequent data analysis.
Descriptive statistics (means ± standard deviations [SD]) for age, height and body mass were measured and recorded in Microsoft Excel at the beginning of the initial testing session, before being transferred to SPSS (version 29) for further analysis. The assessment of normality was conducted via the Shapiro-Wilk test. To assess the within- and between-session reliability, a two-way random ICC with absolute agreement and 95% confidence intervals (95% CI), coefficient of variation (CV) and standard error of the measurement (SEM) were utilised. The interpretation of the ICC utilised values whereby the point estimate of: > 0.90 = excellent, 0.75-0.90 = good, 0.50-0.74 = moderate and < 0.50 = poor.19 The SEM was calculated as: SD*SQRT(1-ICC) and the CV was calculated as: (SD/mean)*100, with values of: < 5% = good, 5-10% = moderate and > 10% = poor.11 A paired samples t-test was used to determine whether there was a statistically significant difference between test sessions for normally distributed data. If data was not normally distributed, a Wilcoxon Signed Rank test was used to determine the same outcome. Hedges g effect size (ES) data with a 95% CI were also calculated to provide an understanding of the practical differences between testing sessions. ES values were interpreted as: < 0.20 = trivial, 0.20-0.49 = small, 0.50-0.79 = moderate, > 0.8 = large.7 The data provided from the movement sensors for JH were calculated from the flight time (FT) data using the equation JH = (9.81 x FT²)/8.3 RSI was calculated as JH ÷ contact time (CT).
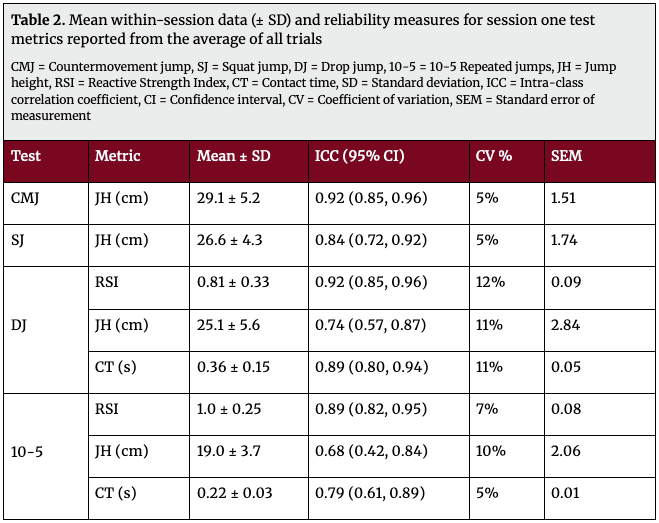
Within-session reliability for test measures is presented for session one in Table 2 and session two in Table 3. In session one, CMJ height exhibited excellent relative and moderate absolute reliability (ICC = 0.92 (0.85,0.96), CV = 5%). SJ height revealed good relative and moderate absolute reliability (ICC = 0.84 (0.72, 0.92), CV = 5%). For the DJ, RSI showed excellent relative and poor absolute reliability (ICC = 0.92 (0.85, 0.96), CV = 12%), JH revealed moderate relative and poor absolute reliability (ICC = 0.74 (0.57, 0.87), CV = 11%), and CT showed good relative and poor absolute reliability. (ICC = 0.89 (0.80, 0.94), CV = 11%). For the 10-5 test, RSI (ICC = 0.89 (0.82, 0.95), CV = 7%) and CT (ICC = 0.79 (0.61, 0.89), CV = 5%) exhibited good relative and moderate absolute reliability, whilst JH revealed moderate relative and poor absolute reliability (ICC = 0.68 (0.42, 0.84), CV = 10%).
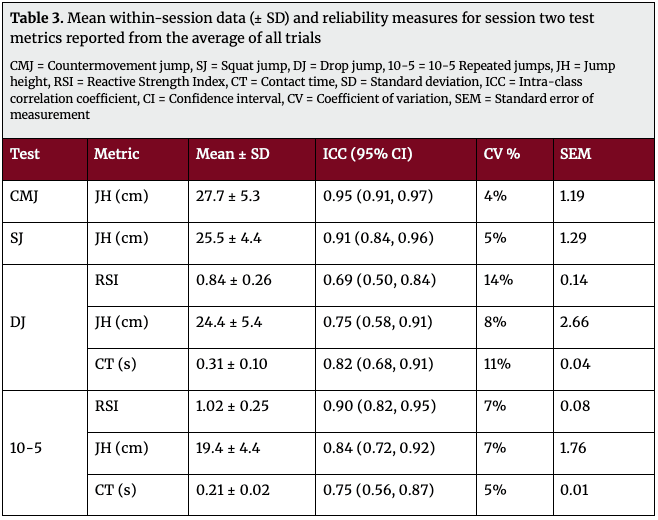
In session two, CMJ height showed excellent relative and good absolute reliability (ICC = 0.95 (0.91, 0.97), CV = 4%). SJ height (ICC = 0.91 (0.84, 0.96), CV = 5%) also showed excellent relative reliability, with moderate absolute reliability also being observed. For the DJ, RSI revealed moderate relative and poor absolute reliability (ICC = 0.69 (0.50, 0.84), CV = 14%), JH revealed good relative and moderate absolute reliability (ICC = 0.75 (0.58, 0.91), CV = 8%) and CT showed good relative and poor absolute reliability (ICC = 0.82 (0.68, 0.91), CV = 11%). For the 10-5 test, RSI showed excellent relative and moderate absolute reliability (ICC = 0.90 (0.82, 0.95), CV = 7%) and both 10-5 JH (ICC = 0.84 (0.72, 0.92), CV = 7%) and CT (ICC = 0.75 (0.56, 0.87), CV = 5%) exhibited good relative and moderate absolute reliability.
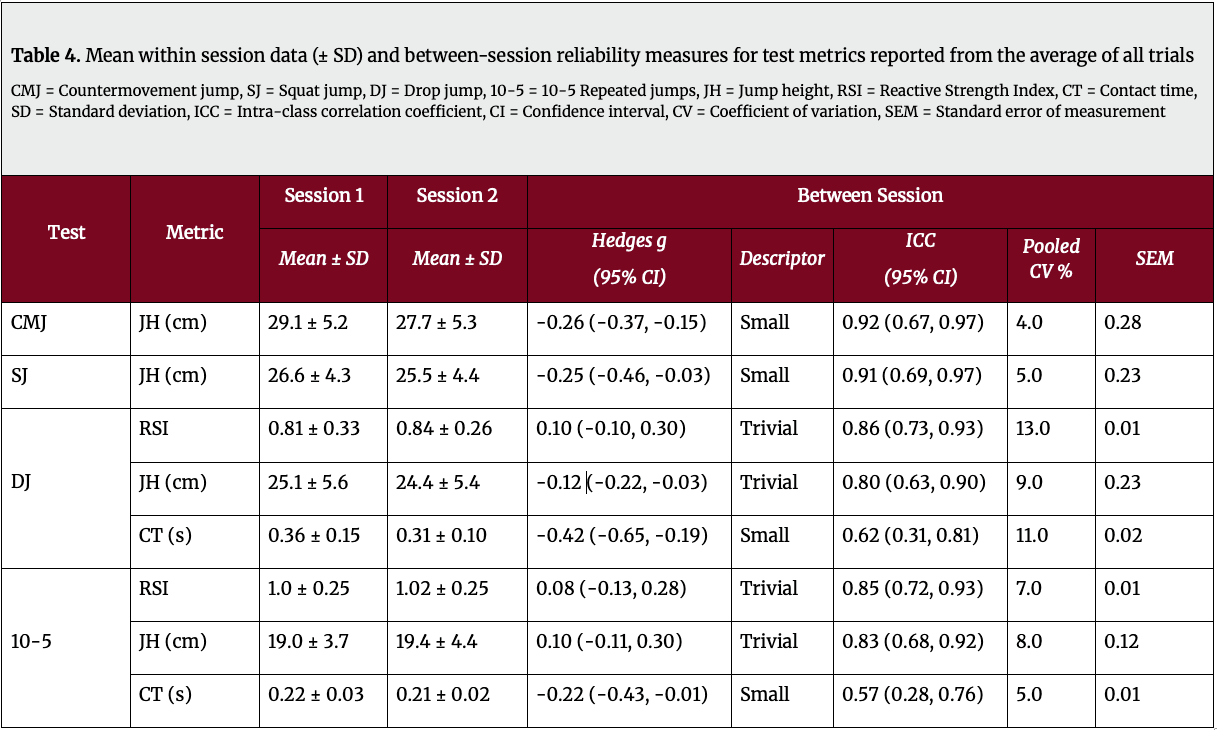
Between-session reliability for test measures is presented in Table 4. CMJ height showed excellent relative reliability (ICC = 0.92 (0.67, 0.97)) and good absolute reliability (CV = 4%). SJ height also revealed excellent relative reliability (ICC = 0.91 (0.69, 0.97)), with moderate absolute reliability (CV = 5%) being observed. DJ RSI (ICC = 0.86 (0.73, 0.93)) revealed good relative reliability and poor absolute reliability (CV = 13%). DJ height also showed good relative reliability, with moderate absolute reliability also being observed (ICC = 0.80 (0.63, 0.90), CV = 9%). DJ CT produced moderate relative reliability and poor absolute reliability (ICC = 0.62 (0.31, 0.81), CV = 11%). For the 10-5 test, RSI (ICC = 0.85 (0.72, 0.93), CV = 7%) and JH (ICC = 0.83 (0.68, 0.92), CV = 8%) produced good relative reliability and poor absolute reliability, whilst 10-5 CT revealed moderate relative and absolute reliability (ICC = 0.57 (0.28, 0.76), CV = 5%).
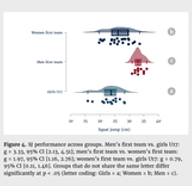
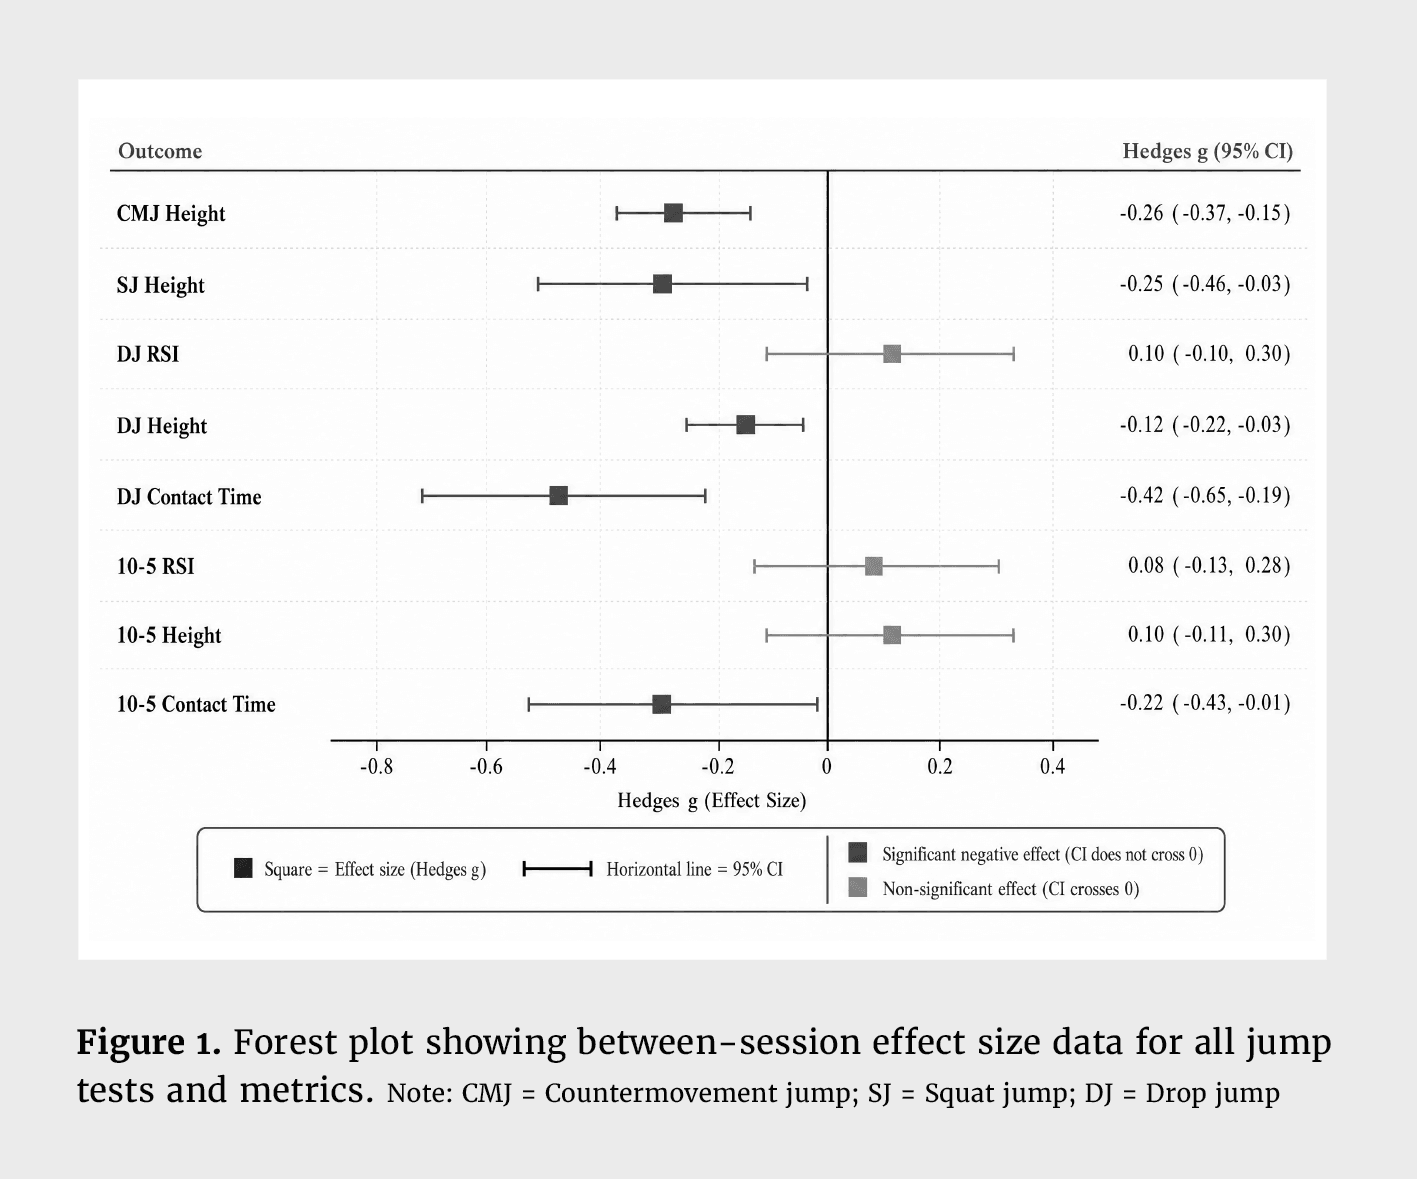
When quantifying differences between test sessions, trivial to small significant reductions in jump performance were observed for CMJ height (g = -0.26, p < 0.05), SJ height (g = -0.25, p < 0.05), DJ height (g = -0.12, p < 0.05), DJ CT (g = -0.42, p < 0.05), and 10-5 CT (g = -0.22, p < 0.05) (Figure 1).
The purpose of this study was to assess the within- and between-session reliability of the CMJ, SJ, DJ and 10-5 jump assessments. The results showed that the CMJ and SJ are reliable for assessing JH when using the Output device, although significant reductions in JH were evident between sessions. DJ RSI, JH and CT all showed acceptable levels of relative reliability (ICC) both within- and between-sessions. In contrast though, the CV showed poor consistency between trials and test sessions. Further to this, there were also significant reductions seen in DJ JH and CT between test sessions. For the 10-5 protocol, RSI, JH and CT also showed acceptable levels of relative and absolute reliability, both within- and between-sessions, with notably less variation in results than the DJ, although the metric of CT also saw significant negative changes between sessions.
Within-session reliability indicated that the CMJ (Session 1 ICC = 0.92 (0.85,0.96), CV = 5%; Session 2 ICC = 0.95 (0.91, 0.97), CV = 4%) and SJ (Session 1 ICC = 0.84 (0.72, 0.92), CV = 5%; Session 2 ICC = 0.91 (0.84, 0.96), CV = 5%) are both reliable tests for measuring JH. The findings for these two tests align with previous research using IMUs (ICC = 0.98; CV = 4%)8 and contact mats (ICC = 0.97; CV = 3%).24 Both the CMJ and SJ have been acknowledged as familiar movements across both youth and adult populations,4, 24 which is a plausible explanation contributing to the high relative and absolute reliability. In contrast, and where the DJ is concerned, our findings indicated substantially greater variability within each session for the metric of RSI (Session 1 ICC = 0.92 (0.85, 0.96), CV = 12%; Session 2 ICC = 0.69 (0.50, 0.84), CV = 14%), which partially aligns with existing research which reported good relative reliability (ICC = 0.77) and poor absolute reliability (CV = 15%) for RSI.29 The DJ test has been previously shown to exhibit higher variability than other jump tests (e.g., CMJ) in youth populations, due to the neuromuscular control and coordination required to perform this fast-SSC movement.34 Important to recognise here, this sample of recreational youth athletes only had a 5 minute familiarisation period prior to data collection trials, which may have been a contributing reason as to why all DJ metrics exhibited CV values > 10%, in one of the sessions. Additionally, the technical instructions provided by Output Sports for the DJ evidently lacked sufficient detail around maximising JH whilst minimising CT. This is required to produce optimal RSI scores.14 Previous research has found that verbal instructions designed to invoke an external focus of attention towards each component part of the RSI metric has shown to increase the reliability of DJ performance, by shortening CT and increasing JH.15 Thus, a critical reflection of this study is that greater attention to detail should have been paid to verbal coaching during this assessment, as opposed to relying solely on the technology’s video instructions. The ICC for DJ RSI also decreased substantially from session one (0.92) to session two (0.69). Given RSI is calculated as JH ÷ CT, it is feasible that the fluctuation in ICC for CT (from 0.89 to 0.82), whilst the ICC for JH remained similar (0.74-0.75), may have had a disproportionate effect on the resultant reliability of RSI. This seems like a plausible explanation given ratio data have been previously identified as problematic from a reliability standpoint.1 Despite these questionable reliability findings in the DJ, superior reliability was evident for RSI in the 10-5 test (Session 1 ICC = 0.89 (0.82, 0.95), CV = 7%; Session 2 ICC = 0.90 (0.82, 0.95), CV = 7%). This is broadly aligned with the findings of previous research which found excellent relative reliability and good absolute reliability for RSI in the same protocol (ICC = 0.96; CV = 4%).31 Although speculative, this may be a by-product of this assessment eliciting data from multiple repetitions within a single trial. Put simply, when data is computed as averages over multiple repetitions (and when considering the rhythmical nature of the test), there is perhaps an auto-regulating effect once athletes ‘get going’.23
For between-session reliability data, the CMJ (ICC = 0.92; CV = 4%) and SJ (ICC = 0.91; CV = 5%) again elicited reliable findings for JH, which is no surprise given reliability data was comparable for each individual session. However, when considering whether any meaningful differences were evident between test sessions, significant reductions in JH were observed for both CMJ (g = -0.26, p < 0.05) and SJ (g = -0.25, p < 0.05) height, perhaps suggesting that variations in jump strategy or acute fatigue in session two may have influenced outcomes. For the DJ test, relative reliability between sessions can be considered acceptable for JH (ICC = 0.80) and RSI (ICC = 0.86), but less confidence in CT data which showed an ICC of 0.62. Equally, both RSI and CT elicited CV values > 10% between sessions, which is too high. Further to this, when considering differences in test scores between sessions, JH and CT showed significant reductions in session two (JH: g = -0.12; CT: g = -0.42). Important to understand however, is that the reduction in JH is a likely consequence of the athletes adopting a stiffer jump strategy in session two, primarily because CT is reduced by 0.05 seconds. Additionally, the SD for CT is notably reduced as well, showing less within-group variation for this metric. Collectively, it would seem that greater familiarisation is needed for the DJ test, in a recreational youth athlete population. Lastly, when considering the 10-5 test, between-session relative reliability data was similar to the DJ (ICC range = 0.57-0.85), with the metric of CT again eliciting the worst value. Coupled with this, CT also showed a significant reduction between sessions (g = -0.22), albeit only 0.01 seconds; indicating there is room for improvements in consistency for this metric. That said, the CV data was noticeably better for the 10-5 protocol (range = 5-8%), potentially supporting less of a learning effect for this test compared to the DJ.
Despite the usefulness of these findings, some limitations were present and should be acknowledged. Firstly, it is beyond the current capability of the Output Sports movement sensors to detect true drop height during the DJ test.25, 28 Force platforms use ground reaction forces (GRF) to calculate the vertical velocity at impact and displacement of the centre of mass (COM) which is used to measure this information. Whilst the Output Sports movement sensors are currently unable to calculate the GRF needed to predict a true drop height, as it calculates JH using the formula proposed by Bosco and colleagues,3 it is feasible to extract the raw accelerometer data which practitioners may wish to consider. In doing so, this will more likely guarantee accurate data as opposed to blindly accepting what the subsequent outputs from the technology produce. It has also been highlighted that those who fell from higher actual drop heights than intended (e.g., stepping/jumping of the box) had lower RSI scores than those who did not.28 Consequently, these differences in measurement methods may have impacted the resultant raw scores and therefore, the subsequent reliability data too. Second, although the present study established the test re-test reliability of these four jump tests, the raw data from these tests were not used beyond this purpose. For example, establishing the relationships with other, independent measures of athletic performance (e.g., linear and/or change of direction speed) would have further enhanced the utility of this dataset.
From a practical perspective, the results from this study show that practitioners working with recreational youth athlete populations can be confident that the measurements of JH during the CMJ and SJ tests are reliable. In contrast, when focused on rebound jumping to examine fast-SSC function, the 10-5 test appears to be a more consistent and reliable option, over the DJ; Thus, is suggested that this protocol is considered to be a superior option. This seems like an especially relevant suggestion given CTs were indicative of fast SSC mechanics in the 10-5 test (i.e., < 0.25 seconds), whereas in the DJ test, the present sample was unable to maintain a comparable jump strategy, with CTs between 0.31-0.36 seconds.

Dan is part of the Strength and Conditioning team at the Isle of Man Sport, co-leading the physical preparation for the Isle of Man Sport Aid Academy.

Shyam is the Programme Lead for the MSc Strength and Conditioning (Distance Education) degree at the London Sport Institute, Middlesex University and the Lead Performance Scientist for British Weightlifting.

Anthony is a Professor of Strength and Conditioning and the Research Degrees Coordinator at the London Sport Institute, Middlesex University.

Chris is an Associate Professor of Strength and Conditioning and the current Head of Department at the London Sport Institute, Middlesex University.
Google Scholar: https://scholar.google.com/citations?user=jep0KcEAAAAJ&hl=en